• E-mail: [email protected]
  • Listening
    • Cambridge IELTS Tests
    • IELTS Practice Tests
    • Recent Actual Tests
  • Reading
    • Cambridge IELTS Tests
    • IELTS Practice Tests
    • Recent Actual Tests
  • Speaking
    • Speaking Part 1
    • Speaking Part 2
    • Speaking Part 3
  • Writing
    • General Training Writing Task 1
    • Academic Writing Task 1
      • Bar Chart
      • Line Graph
      • Pie Chart
      • Table
      • Map
      • Process Diagram
      • Mixed Charts
    • IELTS Writing Task 2
      • Advantages & Disadvantages Essays
      • Agree or Disagree Essays
      • Discuss Both Views Essays
      • Direct Questions Essays
      • Problems/Causes & Solutions Essays
  • Grammar
  • Vocabulary
    • Speaking Vocabulary
    • Writing Vocabulary
    • Collocation for IELTS
  • IELTS Books
  • Blog
No Result
View All Result
No Result
View All Result
Home IELTS Writing

The weight measurements of people living in Charlestown

9IELTS by 9IELTS
August 20, 2022
in IELTS Writing, Academic Writing Task 1, Bar Chart
Reading Time: 2 mins read
17
VIEWS

You should spend about 20 minutes on this task.

The charts summarise the weight measurements of people living in Charlestown in 1955 and 2015. Summarise the information by selecting and reporting the main features, and make comparisons where relevant.

Write at least 150 words.

The-weight-measurements-of-people-living-in-Charlestown.png

Read the model answer below, and choose the correct alternative for each gap.

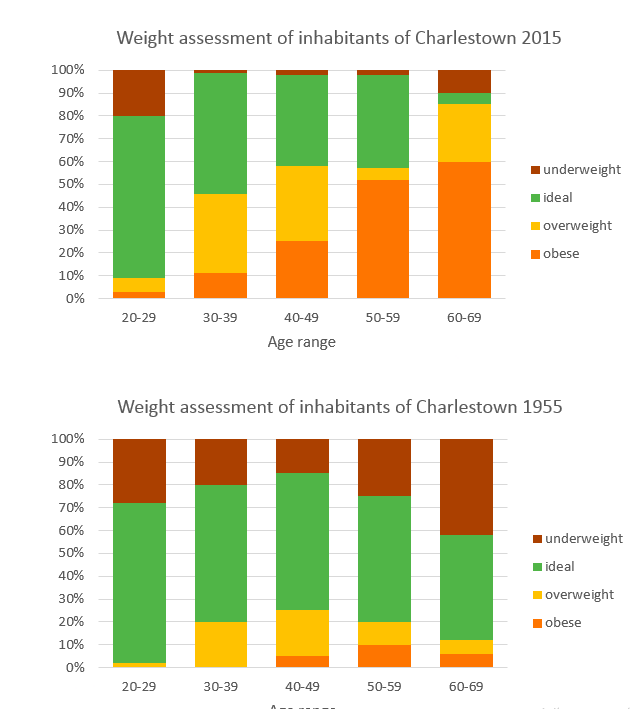
The charts provide an analysis of the weight issues among the residents of the town of Charlestown in 1955 and in 2015.

In 1955, the youngest age group had the fewest ………. of weight issues, with more than 70% of 20-29-year-olds being assessed as having a healthy weight. In the same year, excess weight was only a significant problem among 40-49-year-olds, 20-30% of whom were classified as either overweight or obese. In fact, being underweight was a more significant problem affecting more than twenty ………. of each age group, and the elderly in particular, with 40% of the over 60s being classified as underweight.

In stark contrast to this, ………. 2015, being underweight was only a problem among 20-29-year olds, with 20% obtaining this diagnosis, and the number of underweight elderly people had fallen ………. 10%. The charts clearly show that, in modern times, obesity poses a considerable problem from the age of 30 upwards. In fact, there was a ………. increase in this problem in almost every age group over 29 until the age of 60, when the vast majority are considered to have an unhealthy weight. It is important to note that, by the age of 60, less than 50% of each age group was considered to have a perfect weight by the year 2015. This is a fall ………. 10% compared ………. the same age group in 1955.

When ………. the two years, it is clear that there has been a significant increase ………. the number of obese people in Charlestown, and there was a general drop ………. the number of underweight people between 1955 and 2015.

Previous Post

Information about UK independent films

Next Post

The reasons why people travel to work by bicycle or by car

Leave a Reply Cancel reply

Your email address will not be published. Required fields are marked *

POPULAR POSTS

IELTS Speaking Part 3: Topic 24

Businesses should do anything they can to make a profit

Demographic trends in Scotland

Describe a creative person whom you admire

Working hours are too long

International sporting occasions are essential in easing international tensions

Describe a school rule you did not like when you were in school

Describe a place near water where you enjoyed visiting

IELTS Listening Practice Test 203

The rate of smoking per 1000 people in Someland

About Us

9IELTS

9IELTS is dedicated to providing free materials and resources for IELTS conquerors. Stay constantly updated with a wide range of ultimate tips, strategies, and practice tests to crack the high-stakes IELTS exam!

Recent Posts

Cambridge IELTS 14 Reading Test 2

We have become more independent in modern world

Changes in modes of travel in England between 1985 and 2000

It is pointless to try and keep traditional skills and ways of life alive

Describe a school you have studied in

Disclaimer

The information on this site is for informational purposes only. IELTS is a registered trademark of the University of Cambridge ESOL, the British Council, and IDP Education Australia. This site and its owner are not affiliated, approved or endorsed by University of Cambridge ESOL, the British Council, or IDP Education Australia.
  • About Us
  • Contact Us
  • Disclaimer
  • Terms & Conditions
  • Privacy Policy

© 2023 9IELTS. All Rights Reserved.

No Result
View All Result
  • Listening
    • Cambridge IELTS Tests
    • IELTS Practice Tests
    • Recent Actual Tests
  • Reading
    • Cambridge IELTS Tests
    • IELTS Practice Tests
    • Recent Actual Tests
  • Speaking
    • Speaking Part 1
    • Speaking Part 2
    • Speaking Part 3
  • Writing
    • General Training Writing Task 1
    • Academic Writing Task 1
      • Bar Chart
      • Line Graph
      • Pie Chart
      • Table
      • Map
      • Process Diagram
      • Mixed Charts
    • IELTS Writing Task 2
      • Advantages & Disadvantages Essays
      • Agree or Disagree Essays
      • Discuss Both Views Essays
      • Direct Questions Essays
      • Problems/Causes & Solutions Essays
  • Grammar
  • Vocabulary
    • Speaking Vocabulary
    • Writing Vocabulary
    • Collocation for IELTS
  • IELTS Books
  • Blog

© 2023 9IELTS. All Rights Reserved.

This site uses cookies to offer you a better browsing experience. By continuing to use this website, you agree to our Privacy Policy.