» You are advised to spend about 20 minutes on this task.
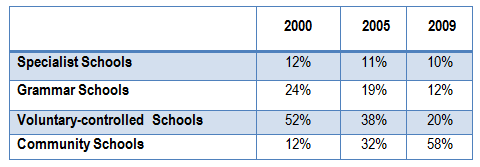
The table shows the proportions of pupils attending four secondary school types between 2000 and 2009. Summarise the information by selecting and reporting the main features, and make comparisons where relevant.
» You should write at least 150 words.
Secondary School Attendance

Sample Answer 1
The table data illustrates changes in students’ choices of secondary schools throughout a nine-year period commencing from 2000.
Overall, it can be seen that voluntary-controlled schools and community schools were the most popular in 2000 and 2009, respectively.
To begin with, more than half of the total pupils went to voluntary-controlled schools in 2000. The figure regarding community schools was just 12 percent – equal to that of specialist schools. At the same time, grammar schools represented just under one-fourth of students.
After five years, the proportion of learners attending community schools increased by 20 percent and further surged to well over 50% in the year 2009. An opposite trend could be observed in the case of voluntary-controlled schools as their figure dipped to 38% in 2005 and 20% in 2009.
Grammar and specialist schools also saw declines in attendance but it is less noticeable. The percentage of pupils in grammar schools dropped marginally as time went by, becoming 11 percent in 2005 and then exactly 10 percent by the end of the given period. Meanwhile, the figure decreased by half in specialist schools throughout the years, standing at 12 percent in 2009.
[Written by – Nguyen Thuong Vu]
Sample Answer 2
The given table presents the percentages of students who chose four different schools in three different years in secondary level. As an overall trend, Voluntary-controlled Schools were the most popular among secondary level students in 2000 while Community Schools gained its popularity among the pupils in 2009.
As can be seen, more than half of the secondary students attended Voluntary-controlled Schools in 2000 while Grammar Schools stood at the second position with 24% pupils. Remaining 24% students were split equally between Specialists Schools and Community Schools. After five years, almost one-third pupils joined Community Schools which showed a 20% increase, while 38% students went to Voluntary-controlled schools, making it still the first choice of the secondary students. The students’ participation decreased by 5% and 1% in Grammar Schools and Specialised Schools respectively in this year. Finally, in 2009, there was a hike in the percentage of pupils who attended Community School which made it the most popular school type in this year. The percentage of attendants of other three schools dropped and all of them managed to gain 42% students in this year with 20% in Voluntary-controlled schools and remaining 22% in other two school types.
In summary, Community Schools were preferred by most of the students in 2009 and Voluntary-controlled Schools were popular in 2005 but not in 2009.
[Written by – Daniel]
