» You should spend about 20 minutes on this task.
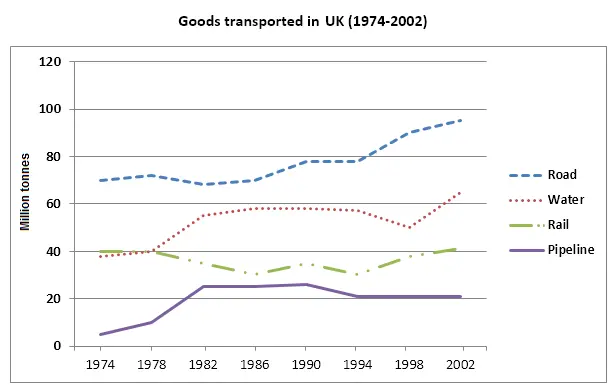
The graph below shows the quantities of goods transported in the UK between 1974 and 2002 by four different modes of transport. Summarise the information by selecting and reporting the main features, and make comparisons where relevant.
» You should write at least 150 words.
Sample Answer
The line graph compares the supply of goods transported in the United Kingdom from 1974 to 2002 via road, water, rail and pipeline. Overall, road transportation and water transportation carried more quantity of goods in the UK than the amount carried by pipelines and rails.
According to the given data, initially in 1974, more than 70 million tonnes of products were transported to the UK on the road while around 40 million tonnes was transported via water and rail transportations. Least quantity of supplies (around 5 million tonnes) was transported in pipelines in this same year. Over the year, the goods transported via road increased with some fluctuations and reached to about 100 million tons in 2002. The water transports were used more for transporting goods to the UK and except in 1998, the amount of goods transported in waterway kept on increasing and finally reached over 60 million tons in 2002. The use of rail transportation system for carrying goods to the UK got reduced as less quantity of goods were transported in rails later years but finally, the quantity reached to 40 million tons in 2002. Finally, goods carried by pipelines increased over the year reached over 20 million tons in 2002.
In summary,
Sample Answer 2:
The graph illustrates the differences in transport from 1974 to 2002 in UK transport. It can be noticed that the graph for pipeline remained steady from 1994 to 2002. However, other means of transportation on roads, water and railways went up slowly in the same year.
Goods transported using pipeline in the UK from 1974 and 2002 stayed constant at 20 million tonnes from 1994 up to 2002, which started at about one million tonnes in 1994. Unlike, Road and Water goods transported in those rose to 40 million tonnes. At the beginning of 1974, Pipeline increased in 1982 to almost 20 million tonnes and still maintained the same level from 1982 to 1990 and between 1990 to 1994 decreased slowly.
Three goods transport in the UK (1974-2002) were Road, Water and Rail showed a rise slowly in 2002. Goods transported in Road got higher than Water and Rail. Although, the waterway goods transportation stayed constant at approximately 60 million tonnes in 1982. Roadway transported goods reduced slowly to about 70 million tonnes. The pipeline had different statistics which increased slowly but most still levelled out at null to twenty million tonnes than others fluctuated from 1975 until 2002.
[ Written by – Dessy Itaar ]
Sample Answer 3:
The line graph indicates the amounts of goods transported using four distinct types of transport in the UK from 1974 to 2002. Overall, it is clearly shown that the amounts of goods transported in the UK by all four different types of transport increased over the given period. It is noticeable that there was a significant rise in the quantities of goods transported by road in the UK from 1974 to 2002.
First and foremost, the most significant change in goods transported in this country on road generally increased from 1974 to 2002. It was about 70 million tonnes in 1974 rose to its highest point at just under100 million tonnes in 2002. This similar increasing trend can be seen on goods transported by water and pipeline, they started just below 40 and about 5 million tonnes respectively and rose to just above 60 and above 20 million tonnes in the last year. Among the three types of transport, goods that were transported on road were the most popular modes of transport.
An opposite trend can be observed for the goods transported using rail. In 1974, it was exactly 40 million tonnes and declined to about 30 million tonnes in 1984. It then showed a fluctuation pattern from 1984 to 1995. It rose considerably until the year 2002 and reached its peak at just over 40 million tonnes.
[ Written by – Lee Wing Qeen ]
Sample Answer 4:
The supplied line graph outlines the goods transportation in the UK from 1974 to 2002 through various modes of transportation namely road, water, rail and pipeline. In general, the quantities of materials transported increased in all types of transportation types over the years.
Looking at the details, goods brought through road transport swelled significantly from about 70 million tons in 1974 to about 95 million tons in 2002, approximately 25 million tons higher than in 1974. The same trend was true for both water and pipeline goods carrying. Water shipping distributed about 39 million tons of materials in 1974 and about 62 million tons in 2002. Pipeline showed the same trend despite the figure of goods carried was roughly slower than water transport, pipeline media only moved about 2 million tons in 1974 and about 21 million tons in 2002.
In contrast, the number of commodities brought through rail mode fluctuated gradually. It was about 40 million tons in 1974 and went down modestly by the year of 1978 and this quantity fluctuated until it levelled up to about 41 million tons in 2002. It accounted for a small change indeed, only about 1 million tons over the years.
[Writtenn by – Linda ]
Sample Answer 5:
The provided line graph reveals information about the figures for commodities transported in the UK from 1974 until 2002 by using four kinds of transportation. Those transportations were roads, water, rail and pipelines. In general, most of the goods transported via those transportation systems unveiled positive trends which increased gradually for 28 years.
It can be seen that the highest amount of commodities transported was shown by land transportation which was around 70 million tonnes in 1974 to approximately 100 million tonnes in 2002. As a result, it can be stated as a huge improvement among other mentioned transportation. In the second place, there was water transportation which gained about 20 million tonnes of goods in the observed years.
Furthermore, the fluctuation trend came from rail transportation. In 1974, the usage of the train for transporting goods was quite similar to water transportation about 40 million tones; however, during the following years, it gave a tiny increase. Subsequently, pipeline carried the lowest amount of supplies in 1974 which was around 10 million tons. After that, this mode of transport brought promising improvement until in 1994 which remained steadily above 20 million tones.
[ Written by – Waode Eti ]