• E-mail: admin@9ielts.com
  • Listening
    • IELTS Practice Tests
    • Recent Actual Tests
  • Reading
    • IELTS Practice Tests
    • Recent Actual Tests
  • Speaking
    • Speaking Part 1
    • Speaking Part 2
    • Speaking Part 3
  • Writing
    • General Training Writing Task 1
    • Academic Writing Task 1
      • Bar Chart
      • Line Graph
      • Pie Chart
      • Table
      • Map
      • Process Diagram
      • Mixed Charts
    • IELTS Writing Task 2
      • Advantages & Disadvantages Essays
      • Agree or Disagree Essays
      • Discuss Both Views Essays
      • Direct Questions Essays
      • Problems/Causes & Solutions Essays
  • Grammar
  • Vocabulary
    • Speaking Vocabulary
    • Writing Vocabulary
    • Collocations for IELTS
  • Books
  • Blog
No Result
View All Result
No Result
View All Result
Home IELTS Writing

The amount of beer and fruit juice consumed per person per year in different countries

9IELTS by 9IELTS
August 2, 2022
in IELTS Writing, Academic Writing Task 1, Table
Reading Time: 2 mins read
39
VIEWS

You should spend about 20 minutes on this task.

The tables below give information about the amount of beer and fruit juice consumed per person per year in different countries. Summarise the information by selecting and reporting the main features, and make comparisons where relevant.

Write at least 150 words.
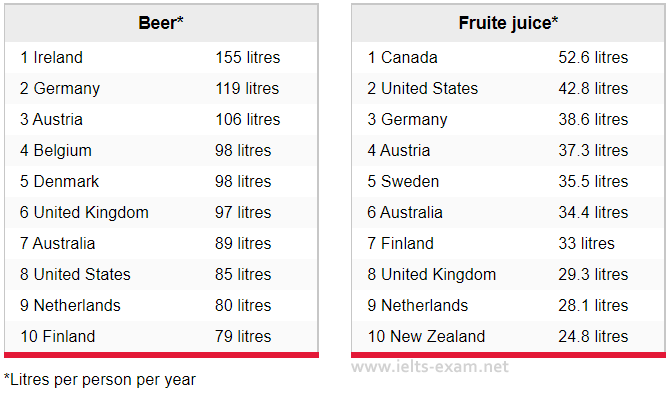
The amount of beer and fruit juice consumed per person per year in different countries

Sample Answer

The tables show the amount of beer and fruit juice consumed per person per year in countries around the world. Beer is most popular in Ireland, with the average Irish drinking 155 litres per year. Germany ranks second with 119 litres per person. In fact, the top six countries in terms of consumption of beer are all European. Australia and The United States come next in seventh and eighth positions, with Netherland and Finland consuming the least beer of the countries mentioned. Finnish people only drink an average of 79 litres of beer a year.

The country which consumes by the greatest quantity of fruit juice per capita is Canada. Canadians drink an average of 52.6 litres each a year, that’s almost double the consumption of New Zealand, which is placed at the bottom of the table. Another North American country, The United States, come second in the table, while German drinkers are ranked at number three, consuming an average of 38.6 litres annually. Swedes drink approximately the same quantity of fruit juice as Australians, which is 35.5 litres per year. The Finnish and the British drink 33 and 29.3 litres per year respectively.

(194 words)

Previous Post

The demand for electricity in England during typical days in winter and summer

Next Post

Radio and television audiences throughout the day in 1992

Leave a Reply Cancel reply

Your email address will not be published. Required fields are marked *

POPULAR POSTS

Cambridge IELTS 1-19 Book Series [PDF + Audio]

Cambridge IELTS 20 Academic [Update 2025]

Cambridge IELTS 19 Academic [PDF + Audio]

200 IELTS Speaking Sample Answers [PDF + Audio]

Cambridge IELTS 18 Academic [PDF + Audio]

IELTS Recent Actual Tests [Full PDF + Audio]

IELTS Listening Practice Test 204

Cambridge IELTS 18 General Training [PDF + Audio]

IELTS Reading Practice Test 320

Cambridge IELTS 17 General Training [PDF + Audio]

About Us

9ielts logo

9IELTS is dedicated to providing free materials and resources for IELTS conquerors. Stay constantly updated with a wide range of ultimate tips, strategies, and practice tests to crack the high-stakes IELTS exam!

Recent Posts

Letter to your friend about the museum you have visited

Many countries are experiencing serious problems with their environment

The rich are becoming richer and the poor are becoming poorer

IELTS Reading Recent Actual Test 19

To succeed in a business, one needs to know maths

Disclaimer

The information on this site is for informational purposes only. IELTS is a registered trademark of the University of Cambridge ESOL, the British Council, and IDP Education Australia. This site and its owners are not affiliated, approved or endorsed by University of Cambridge ESOL, the British Council, or IDP Education Australia.
  • About Us
  • Contact Us
  • Disclaimer
  • Terms & Conditions
  • Privacy Policy

© 2024 9IELTS. All Rights Reserved.

No Result
View All Result
  • Listening
    • IELTS Practice Tests
    • Recent Actual Tests
  • Reading
    • IELTS Practice Tests
    • Recent Actual Tests
  • Speaking
    • Speaking Part 1
    • Speaking Part 2
    • Speaking Part 3
  • Writing
    • General Training Writing Task 1
    • Academic Writing Task 1
      • Bar Chart
      • Line Graph
      • Pie Chart
      • Table
      • Map
      • Process Diagram
      • Mixed Charts
    • IELTS Writing Task 2
      • Advantages & Disadvantages Essays
      • Agree or Disagree Essays
      • Discuss Both Views Essays
      • Direct Questions Essays
      • Problems/Causes & Solutions Essays
  • Grammar
  • Vocabulary
    • Speaking Vocabulary
    • Writing Vocabulary
    • Collocations for IELTS
  • Books
  • Blog

© 2024 9IELTS. All Rights Reserved.