• E-mail: admin@9ielts.com
  • Listening
    • IELTS Practice Tests
    • Recent Actual Tests
  • Reading
    • IELTS Practice Tests
    • Recent Actual Tests
  • Speaking
    • Speaking Part 1
    • Speaking Part 2
    • Speaking Part 3
  • Writing
    • General Training Writing Task 1
    • Academic Writing Task 1
      • Bar Chart
      • Line Graph
      • Pie Chart
      • Table
      • Map
      • Process Diagram
      • Mixed Charts
    • IELTS Writing Task 2
      • Advantages & Disadvantages Essays
      • Agree or Disagree Essays
      • Discuss Both Views Essays
      • Direct Questions Essays
      • Problems/Causes & Solutions Essays
  • Grammar
  • Vocabulary
    • Speaking Vocabulary
    • Writing Vocabulary
    • Collocations for IELTS
  • Books
  • Blog
No Result
View All Result
No Result
View All Result
Home IELTS Writing

The demand for electricity in England during typical days in winter and summer

9IELTS by 9IELTS
August 2, 2022
in IELTS Writing, Academic Writing Task 1, Mixed Charts
Reading Time: 2 mins read
95
VIEWS

You should spend about 20 minutes on this task.

The graph below shows the demand for electricity in England during typical days in winter and summer. The pie chart shows how electricity is used in an average English home. Summarise the information by selecting and reporting the main features, and make comparisons where relevant.

Write at least 150 words.
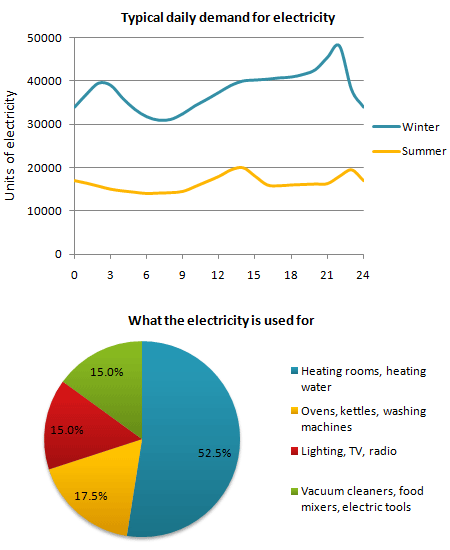
The demand for electricity in England during typical days in winter and summer

Sample answer

The Demand for electricity in England during typical days in winter and summer is illustrated in the graph. The use of electricity in an average English home is shown in the pie chart. From the graph it is generally obvious that the demand is in its maximum around 2100 in winter times and in its minimum around 400 being almost constant between 1200 and 2100 in winter times. During summer times on the other hand the demand reaches its top point around 1300 and the bottom point around 900 being almost constant between 1550 and 2000.

In wither times the curve gradually increases to reach 40000 units of electricity by 3 o’clock in the morning. This is followed by gradual decline to its lowest limit of 30000 units at 9 o’clock. A gradual rise is obvious again to reach a stationary level between 3 o’clock and 9 o’clock of about 40000 units again. Then there is a sharp rise in the next hour to reach its maximum before collapsing again to a lower level by the end of the day.

In summer time the curve gradually decrease to reach its lower limit around 9 o’clock of a bit more that 10000 units. A gradual increase is noticed to reach its top of 20000 after which a stationary phase is obvious between 3 o’clock and 10 o’clock at night of about 15000 units.

The pie chart on the other hand shows that 52.5% of the electricity is used for heating rooms and water. 17.5% is consumed for ovens kettles and washing machines 15% is used in lighting TV and radio and finally 15% is consumed in the sue of vacuum cleaners food mixtures and electric tools.

(285 words)

Previous Post

The share of the UK and Australian cinema market in 2001 and cinema admission in the UK and Australia from 1976 to 2006

Next Post

The amount of beer and fruit juice consumed per person per year in different countries

Leave a Reply Cancel reply

Your email address will not be published. Required fields are marked *

POPULAR POSTS

Cambridge IELTS 1-19 Book Series [PDF + Audio]

Cambridge IELTS 20 Academic [Update 2025]

Cambridge IELTS 19 Academic [PDF + Audio]

200 IELTS Speaking Sample Answers [PDF + Audio]

Cambridge IELTS 18 Academic [PDF + Audio]

IELTS Recent Actual Tests [Full PDF + Audio]

IELTS Listening Practice Test 204

Cambridge IELTS 18 General Training [PDF + Audio]

IELTS Reading Practice Test 320

Cambridge IELTS 17 General Training [PDF + Audio]

About Us

9ielts logo

9IELTS is dedicated to providing free materials and resources for IELTS conquerors. Stay constantly updated with a wide range of ultimate tips, strategies, and practice tests to crack the high-stakes IELTS exam!

Recent Posts

Pollution and other environmental problems are resulting from

Some people like to try new things, for example, places to visit

Describe a teacher from the past whom you remember

Teenage years are the happiest of our lives

IELTS Reading Practice Test 293

Disclaimer

The information on this site is for informational purposes only. IELTS is a registered trademark of the University of Cambridge ESOL, the British Council, and IDP Education Australia. This site and its owners are not affiliated, approved or endorsed by University of Cambridge ESOL, the British Council, or IDP Education Australia.
  • About Us
  • Contact Us
  • Disclaimer
  • Terms & Conditions
  • Privacy Policy

© 2024 9IELTS. All Rights Reserved.

No Result
View All Result
  • Listening
    • IELTS Practice Tests
    • Recent Actual Tests
  • Reading
    • IELTS Practice Tests
    • Recent Actual Tests
  • Speaking
    • Speaking Part 1
    • Speaking Part 2
    • Speaking Part 3
  • Writing
    • General Training Writing Task 1
    • Academic Writing Task 1
      • Bar Chart
      • Line Graph
      • Pie Chart
      • Table
      • Map
      • Process Diagram
      • Mixed Charts
    • IELTS Writing Task 2
      • Advantages & Disadvantages Essays
      • Agree or Disagree Essays
      • Discuss Both Views Essays
      • Direct Questions Essays
      • Problems/Causes & Solutions Essays
  • Grammar
  • Vocabulary
    • Speaking Vocabulary
    • Writing Vocabulary
    • Collocations for IELTS
  • Books
  • Blog

© 2024 9IELTS. All Rights Reserved.