• E-mail: [email protected]
  • Listening
    • Cambridge IELTS Tests
    • IELTS Practice Tests
    • Recent Actual Tests
  • Reading
    • Cambridge IELTS Tests
    • IELTS Practice Tests
    • Recent Actual Tests
  • Speaking
    • Speaking Part 1
    • Speaking Part 2
    • Speaking Part 3
  • Writing
    • General Training Writing Task 1
    • Academic Writing Task 1
      • Bar Chart
      • Line Graph
      • Pie Chart
      • Table
      • Map
      • Process Diagram
      • Mixed Charts
    • IELTS Writing Task 2
      • Advantages & Disadvantages Essays
      • Agree or Disagree Essays
      • Discuss Both Views Essays
      • Direct Questions Essays
      • Problems/Causes & Solutions Essays
  • Grammar
  • Vocabulary
    • Speaking Vocabulary
    • Writing Vocabulary
    • Collocation for IELTS
  • IELTS Books
  • Blog
No Result
View All Result
No Result
View All Result
Home IELTS Writing

The area of forest logged in and forest-dwelling species in Southwest region

9IELTS by 9IELTS
November 5, 2022
in IELTS Writing, Academic Writing Task 1, Mixed Charts
Reading Time: 2 mins read
15
VIEWS

» You should spend about 20 minutes on this task.

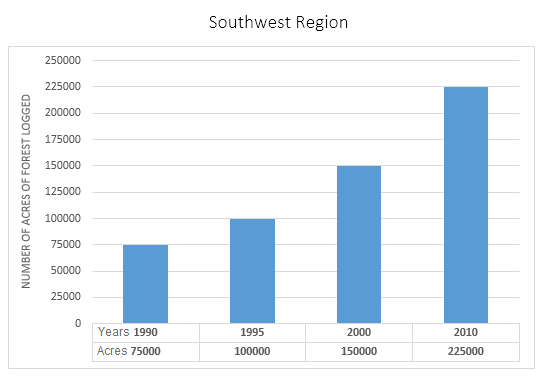
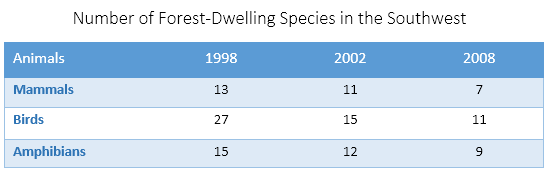
The bar graph below shows the area of forest logged in Southwest region and the table presents the number of forest-dwelling species in the same region.

Summarise the information by selecting and reporting the main features, and make comparisons where relevant.

You should write at least 150 words.

Area of forest logged in and forest-dwelling species in Southwest region
Area of forest logged in and forest-dwelling species in Southwest region.2

Sample Answer

The bar chart shows the total area logged in the Southern region in four different years, and the table shows the number of mammals, birds, and amphibian species in this region. A glance at the illustration reveals that login activities in the Southern area increased over time, and the number of species as an effect has decreased.

Back to the details, 75 thousand acres of forest were cut down in 1990, which just doubled in 10 years. Finally, in 2010, precisely 225 thousand acres of forest were logged down, more than thrice the logging area in 1990. The table shows that in 1998 there were 13 mammals, 27 birds, and 15 amphibian species in the Southeast forests, which kept decreasing over time.

In just four years, 2 mammal species disappeared from the forest and in 10 years, 6 mammal species disappeared. The worst case was for birds; in 2008, the number of bird species declined to only 11 from the initial figure of 27 in 1998. In the case of amphibians, more than 6 species got lost from the forest in just 10 years.

Previous Post

Very few school children learn about the value of money

Next Post

Children brought up in families with less money are better prepared

Leave a Reply

Your email address will not be published. Required fields are marked *

POPULAR POSTS

Overpopulation of urban areas has led to numerous problems

Describe an outdoor activity that you did for the first time

Transport used to travel to and from work in European city

Describe a special trip in the near future

Area of land from which grain was harvested

Pollution and other environmental problems are resulting from

The share of the UK and Australian cinema market in 2001 and cinema admission in the UK and Australia from 1976 to 2006

Compare the proportion of energy capacity in gigawatts (GW)

Describe an occasion when you got up very early

Individuals are becoming more dependent on each other in modern society

About Us

9IELTS

9IELTS is dedicated to providing free materials and resources for IELTS conquerors. Stay constantly updated with a wide range of ultimate tips, strategies, and practice tests to crack the high-stakes IELTS exam!

Recent Posts

Societies benefit from closer relationship we have with foreigners

Governments should provide retirement homes

Describe a cafe you like to visit

Describe a place near water

School authorities should not spend time and money on music classes

Disclaimer

The information on this site is for informational purposes only. IELTS is a registered trademark of the University of Cambridge ESOL, the British Council, and IDP Education Australia. This site and its owner are not affiliated, approved or endorsed by University of Cambridge ESOL, the British Council, or IDP Education Australia.
  • About Us
  • Contact Us
  • Disclaimer
  • Terms & Conditions
  • Privacy Policy

Copyright © 2023 9IELTS. All Rights Reserved.

No Result
View All Result
  • Listening
    • Cambridge IELTS Tests
    • IELTS Practice Tests
    • Recent Actual Tests
  • Reading
    • Cambridge IELTS Tests
    • IELTS Practice Tests
    • Recent Actual Tests
  • Speaking
    • Speaking Part 1
    • Speaking Part 2
    • Speaking Part 3
  • Writing
    • General Training Writing Task 1
    • Academic Writing Task 1
      • Bar Chart
      • Line Graph
      • Pie Chart
      • Table
      • Map
      • Process Diagram
      • Mixed Charts
    • IELTS Writing Task 2
      • Advantages & Disadvantages Essays
      • Agree or Disagree Essays
      • Discuss Both Views Essays
      • Direct Questions Essays
      • Problems/Causes & Solutions Essays
  • Grammar
  • Vocabulary
    • Speaking Vocabulary
    • Writing Vocabulary
    • Collocation for IELTS
  • IELTS Books
  • Blog

Copyright © 2023 9IELTS. All Rights Reserved.

This site uses cookies to offer you a better browsing experience. By continuing to use this website, you agree to our Privacy Policy.