• E-mail: [email protected]
  • Listening
    • Cambridge IELTS Tests
    • IELTS Practice Tests
    • Recent Actual Tests
  • Reading
    • Cambridge IELTS Tests
    • IELTS Practice Tests
    • Recent Actual Tests
  • Speaking
    • Speaking Part 1
    • Speaking Part 2
    • Speaking Part 3
  • Writing
    • General Training Writing Task 1
    • Academic Writing Task 1
      • Bar Chart
      • Line Graph
      • Pie Chart
      • Table
      • Map
      • Process Diagram
      • Mixed Charts
    • IELTS Writing Task 2
      • Advantages & Disadvantages Essays
      • Agree or Disagree Essays
      • Discuss Both Views Essays
      • Direct Questions Essays
      • Problems/Causes & Solutions Essays
  • Grammar
  • Vocabulary
    • Speaking Vocabulary
    • Writing Vocabulary
    • Collocation for IELTS
  • IELTS Books
  • Blog
No Result
View All Result
No Result
View All Result
Home IELTS Writing

The average monthly temperatures in three cities

9IELTS by 9IELTS
November 5, 2022
in IELTS Writing, Academic Writing Task 1, Line Graph
Reading Time: 3 mins read
14
VIEWS

You should spend about 20 minutes on this task.

The line graph below shows the average monthly temperatures in three major cities.

Summarize the information by selecting and reporting the main features, and make comparisons where relevant.

You should write at least 150 words.
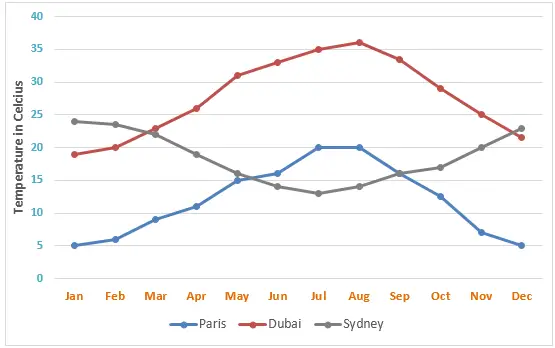
the average monthly temperatures in three major cities

Sample Answer 1

The line graph displays the changes in temperature in three cities (Paris, Dubai and Sydney) at different months of the year. Temperature is measured in Celsius degrees.

Overall, the weather pattern in Sydney is quite the opposite of Dubai and Paris. Furthermore, Paris is the coldest city among the three.

To begin with, the temperature in Paris never goes above 20 degrees. In contrast, Dubai seldom sees its temperature below this level, except for January (19 degrees C). However, despite the striking differences, the temperatures in Paris and Dubai still have some similarities, as they rise continually from the beginning of the year to a peak in August. The highest temperature in Paris and Dubai are 20 and 36 degrees, respectively. Afterwards, both cities became colder, and the temperature fell steadily. As can be seen, the differences in temperature between August and December in both Paris and Dubai are the same, 15 degrees Celsius.

Regarding Sydney, it witnessed 24-degree temperatures in January. From there, the temperature drops continuously before reaching the lowest point of 14 degrees in July. The five remaining months see the temperature increase dramatically, to reach 23 degrees by the end of the year.

Sample Answer 2

The average monthly temperature of three cities – Paris, Dubai and Sydney, is given in the bar graph, and the data compares how the temperature in these cities changes throughout the year. The temperature is measured in Celsius. Overall, Dubai and Paris have comparatively warmer conditions between April and August, while an opposite trend is witnessed in Sydney, where the first two and last two months of the year have a higher temperatures.

As the illustration suggests, the temperature in Sydney is roughly 25-degree centigrade in January, which is the warmest month of the year there. At that time, the temperature in Dubai is just below 20 degrees, which is this city’s coldest month. At 5 degrees centigrade, Paris at that time behold the coldest month of the year.

The temperature in Sydney remains above 20-degree till mid-March, then it keeps falling till July when it has nearly 13 centigrade temperatures, the coolest. The temperature there steadily increases throughout the year before reaching 23-degree in December. Conversely, Paris’s temperature remains below 20 degrees throughout the year except in July and August. Paris seems like the coldest city among the three. Finally, the temperature in Dubai reaches as high as 36-degree centigrade in August, and this city has a warmer condition from April to October.

Previous Post

GDP in four countries between 2010 and 2015

Next Post

Some employment patterns in Great Britain in 1992

Leave a Reply Cancel reply

Your email address will not be published. Required fields are marked *

POPULAR POSTS

IELTS Listening Practice Test 11

You are not happy about a service you received

Describe your favourite season

Children should be co-operative to learn more and to become better

Describe an item you would buy if you receive a large amount of money

Number of enquiries to tourist information office

Some businesses prohibit smoking in any of their offices

Public libraries should provide books and not waste their limited resources

Describe a book you have recently read

Describe a time when you tried a new food for the first time

About Us

9IELTS

9IELTS is dedicated to providing free materials and resources for IELTS conquerors. Stay constantly updated with a wide range of ultimate tips, strategies, and practice tests to crack the high-stakes IELTS exam!

Recent Posts

Describe a Place Where You Spend Most of Your Free Time

Developments in technology have brought various environmental problems

Describe a piece of music you like

Your car is hired from a company and while you are driving on holiday

IELTS Speaking Part 1: Work

Disclaimer

The information on this site is for informational purposes only. IELTS is a registered trademark of the University of Cambridge ESOL, the British Council, and IDP Education Australia. This site and its owner are not affiliated, approved or endorsed by University of Cambridge ESOL, the British Council, or IDP Education Australia.
  • About Us
  • Contact Us
  • Disclaimer
  • Terms & Conditions
  • Privacy Policy

Copyright © 2023 9IELTS. All Rights Reserved.

No Result
View All Result
  • Listening
    • Cambridge IELTS Tests
    • IELTS Practice Tests
    • Recent Actual Tests
  • Reading
    • Cambridge IELTS Tests
    • IELTS Practice Tests
    • Recent Actual Tests
  • Speaking
    • Speaking Part 1
    • Speaking Part 2
    • Speaking Part 3
  • Writing
    • General Training Writing Task 1
    • Academic Writing Task 1
      • Bar Chart
      • Line Graph
      • Pie Chart
      • Table
      • Map
      • Process Diagram
      • Mixed Charts
    • IELTS Writing Task 2
      • Advantages & Disadvantages Essays
      • Agree or Disagree Essays
      • Discuss Both Views Essays
      • Direct Questions Essays
      • Problems/Causes & Solutions Essays
  • Grammar
  • Vocabulary
    • Speaking Vocabulary
    • Writing Vocabulary
    • Collocation for IELTS
  • IELTS Books
  • Blog

Copyright © 2023 9IELTS. All Rights Reserved.

This site uses cookies to offer you a better browsing experience. By continuing to use this website, you agree to our Privacy Policy.