You should spend about 20 minutes on this task.
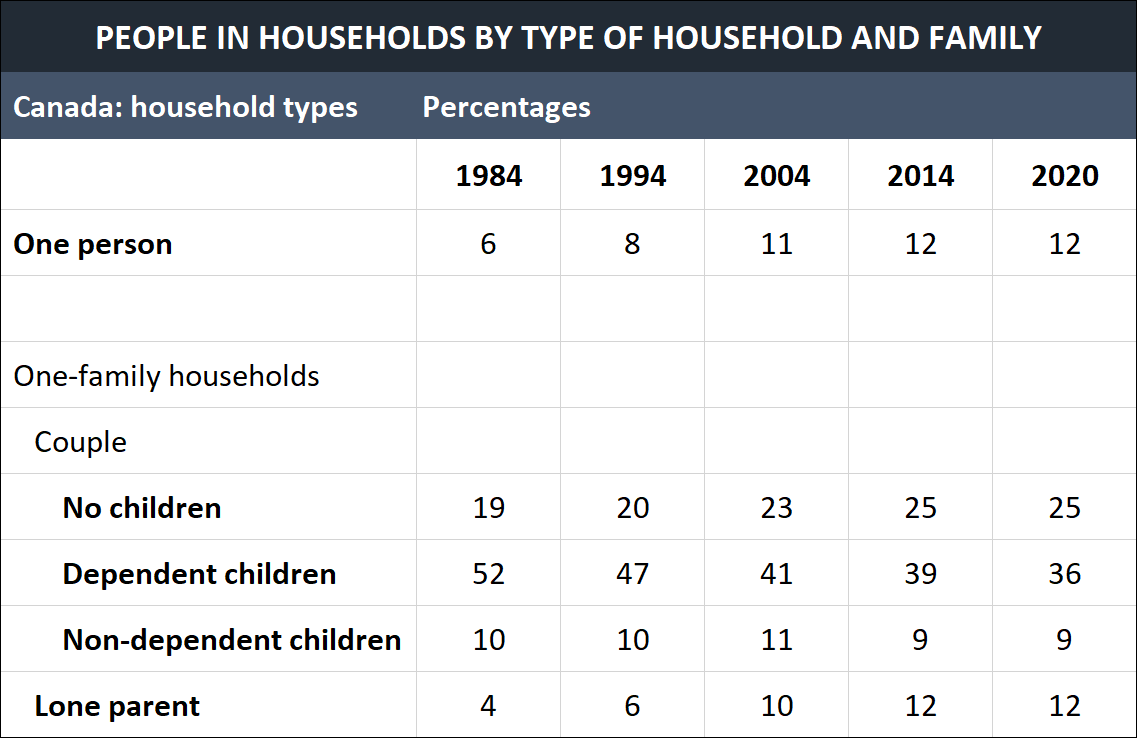
The table below shows the changes in some household types in Canada from 1984 to 2020. Summarise the information by selecting and reporting the main features, and make comparisons where relevant.
Write at least 150 words.

Sample Answer
The table shows the changes in household types in Canada at 10-year intervals from 1984 to 2014 and again in 2020.
There has been a steady increase in households without children during this period. One-person households doubled from 6% in 1984 to 12% in 2020, whilst the percentage of couples with no children rose from 19% in 1984 to 23% in 2004 and to 25% in 2014. However, this figure levelled out in 2020. Even bigger changes have occurred when it comes to couples with dependent children. This category shrank from 52% in 1984 to 36% in 2020. In contrast, the percentage of lone parents trebled over the same period, rising from 4% in 1984 to 12% in 2020. The percentage of families with non-dependent children has remained more stable: 10% in 1984, rising only 1% over the next 20 years before falling to 9% in 2014.
In conclusion, the table shows definite patterns of change within the Canadian family over the past 40 years, in particular the decline in the traditional. model of one couple with dependent children.
(179 words)
