• E-mail: admin@9ielts.com
  • Listening
    • IELTS Practice Tests
    • Recent Actual Tests
  • Reading
    • IELTS Practice Tests
    • Recent Actual Tests
  • Speaking
    • Speaking Part 1
    • Speaking Part 2
    • Speaking Part 3
  • Writing
    • General Training Writing Task 1
    • Academic Writing Task 1
      • Bar Chart
      • Line Graph
      • Pie Chart
      • Table
      • Map
      • Process Diagram
      • Mixed Charts
    • IELTS Writing Task 2
      • Advantages & Disadvantages Essays
      • Agree or Disagree Essays
      • Discuss Both Views Essays
      • Direct Questions Essays
      • Problems/Causes & Solutions Essays
  • Grammar
  • Vocabulary
    • Speaking Vocabulary
    • Writing Vocabulary
    • Collocations for IELTS
  • Books
  • Blog
No Result
View All Result
No Result
View All Result
Home IELTS Writing

The differences in wheat exports over three different areas

9IELTS by 9IELTS
August 2, 2022
in IELTS Writing, Academic Writing Task 1, Line Graph
Reading Time: 2 mins read
34
VIEWS

You should spend about 20 minutes on this task.

The graph below shows the differences in wheat exports over three different areas. Write a report for a university lecturer describing the information shown below.

Write at least 150 words.
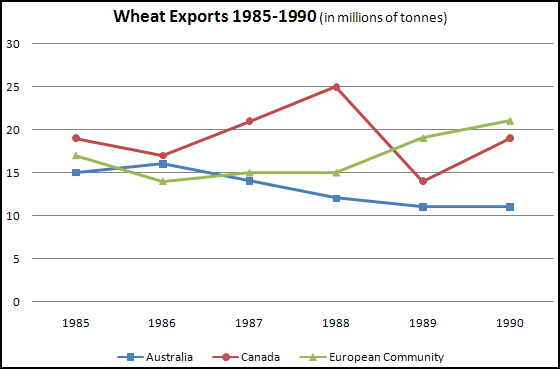
The differences in wheat exports over three different areas

Sample answer

The three graphs of wheat exports each show a quite different pattern between 1985 and 1990. Exports from Australia declined over the five-year period, while the Canadian market fluctuated considerably, and the European Community showed an increase.

In 1985, Australia exported about 15 millions of tonnes of wheat and the following year the number increased by one million tonnes to 16 million. After that, however, there was a gradual decline until 1989 and 1990 when it stabilised at about 11 million tonnes. Over the same period, the amount of Canadian exports varied greatly. It started at 19 million tonnes in 1985, reached a peak in 1988 of 24 million, dropped dramatically in 1989 to 14 million tonnes and then climbed back to 19 million in 1990. Seventeen million tonnes were exported from the European Community in 1985, but this decreased to 14 million tonnes in 1986 and then rose to 15 million in 1987 and 1988 before increasing once more to 20 million in 1990.

(165 words)

Previous Post

The main sources of energy in the USA in the 1980s and the 1990s

Next Post

The production of coloured plastic paper clips in a small factory

Leave a Reply Cancel reply

Your email address will not be published. Required fields are marked *

POPULAR POSTS

Cambridge IELTS 1-19 Book Series [PDF + Audio]

Cambridge IELTS 20 Academic [Update 2025]

Cambridge IELTS 19 Academic [PDF + Audio]

200 IELTS Speaking Sample Answers [PDF + Audio]

Cambridge IELTS 18 Academic [PDF + Audio]

IELTS Recent Actual Tests [Full PDF + Audio]

IELTS Listening Practice Test 204

Cambridge IELTS 18 General Training [PDF + Audio]

IELTS Reading Practice Test 320

Cambridge IELTS 17 General Training [PDF + Audio]

About Us

9ielts logo

9IELTS is dedicated to providing free materials and resources for IELTS conquerors. Stay constantly updated with a wide range of ultimate tips, strategies, and practice tests to crack the high-stakes IELTS exam!

Recent Posts

The proportion of different categories of families living in poverty in Australia in 1999

Young people are encouraged to work or travel for a year

Demographic trends in Scotland

Describe a cybercafe/internet cafe you often visit

IELTS Reading Practice Test 88

Disclaimer

The information on this site is for informational purposes only. IELTS is a registered trademark of the University of Cambridge ESOL, the British Council, and IDP Education Australia. This site and its owners are not affiliated, approved or endorsed by University of Cambridge ESOL, the British Council, or IDP Education Australia.
  • About Us
  • Contact Us
  • Disclaimer
  • Terms & Conditions
  • Privacy Policy

© 2024 9IELTS. All Rights Reserved.

No Result
View All Result
  • Listening
    • IELTS Practice Tests
    • Recent Actual Tests
  • Reading
    • IELTS Practice Tests
    • Recent Actual Tests
  • Speaking
    • Speaking Part 1
    • Speaking Part 2
    • Speaking Part 3
  • Writing
    • General Training Writing Task 1
    • Academic Writing Task 1
      • Bar Chart
      • Line Graph
      • Pie Chart
      • Table
      • Map
      • Process Diagram
      • Mixed Charts
    • IELTS Writing Task 2
      • Advantages & Disadvantages Essays
      • Agree or Disagree Essays
      • Discuss Both Views Essays
      • Direct Questions Essays
      • Problems/Causes & Solutions Essays
  • Grammar
  • Vocabulary
    • Speaking Vocabulary
    • Writing Vocabulary
    • Collocations for IELTS
  • Books
  • Blog

© 2024 9IELTS. All Rights Reserved.