• E-mail: [email protected]
  • Listening
    • Cambridge IELTS Tests
    • IELTS Practice Tests
    • Recent Actual Tests
  • Reading
    • Cambridge IELTS Tests
    • IELTS Practice Tests
    • Recent Actual Tests
  • Speaking
    • Speaking Part 1
    • Speaking Part 2
    • Speaking Part 3
  • Writing
    • General Training Writing Task 1
    • Academic Writing Task 1
      • Bar Chart
      • Line Graph
      • Pie Chart
      • Table
      • Map
      • Process Diagram
      • Mixed Charts
    • IELTS Writing Task 2
      • Advantages & Disadvantages Essays
      • Agree or Disagree Essays
      • Discuss Both Views Essays
      • Direct Questions Essays
      • Problems/Causes & Solutions Essays
  • Grammar
  • Vocabulary
    • Speaking Vocabulary
    • Writing Vocabulary
    • Collocation for IELTS
  • IELTS Books
  • Blog
No Result
View All Result
No Result
View All Result
Home IELTS Writing

The proportions of graduates from Brighton University in 2019 entering different employment sectors

9IELTS by 9IELTS
October 14, 2022
in IELTS Writing, Academic Writing Task 1, Pie Chart
Reading Time: 2 mins read
155
VIEWS

You should spend about 20 minutes on this task.

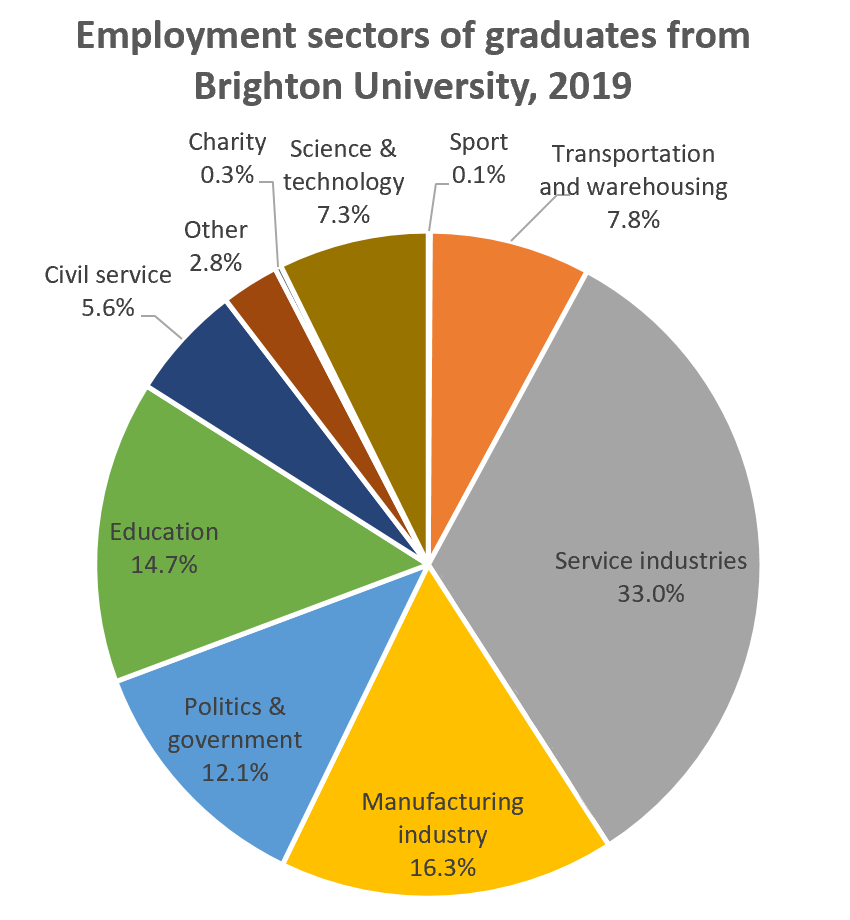
The chart below shows the proportions of graduates from Brighton University in 2019 entering different employment sectors.

the proportions of graduates from Brighton University in 2019 entering different employment sectors.

Summarise the information by selecting and reporting the main features, and make comparisons where relevant.

Write at least 150 words.

Sample answer

The pie chart illustrates the career choices of Brighton University’s 2019 graduates, giving the percentages who worked in each of various sectors after finishing university. Overwhelmingly, industry and government were the most popular choices.

Just under half of the students went into industry, with service industries attracting more Brighton graduates than any other sector — almost a third (33.0%). About half that number (16.3%) took jobs in manufacturing.

Politics and public service were the next most popular choice, accounting for nearly a fifth of graduates. Just over 12% went into politics, and a further 5.6% chose the civil service. The other significant career choices were education (about 15%), transportation and warehousing, 7.8%), and science and technology, 7.3%).

The least popular choices included work in the charitable sector and careers in sports, which were chosen by well under 1% of graduates. Finally, 2.8% entered work in other, unspecified sectors.

Previous Post

The percentage of part-time workers in each country of the United Kingdom in 1980 and 2010

Next Post

The diagram illustrates how bees produce honey

Leave a Reply

Your email address will not be published. Required fields are marked *

POPULAR POSTS

Describe a person in the news whom you want to meet

It is more important to have an enjoyable job than to earn a lot of money

IELTS Listening Recent Actual Test 03

Smart IELTS Vocabulary and Grammar [PDF] Free

Collocation for IELTS: Tourism

IELTS Reading Practice Test 03 

Government should make more efforts to promote alternative sources of energy

Number of minutes of telephone calls in Finland

Encouraging the development of creative industries

IELTS Reading Practice Test 92

About Us

9IELTS

9IELTS is dedicated to providing free materials and resources for IELTS conquerors. Stay constantly updated with a wide range of ultimate tips, strategies, and practice tests to crack the high-stakes IELTS exam!

Recent Posts

IELTS Speaking Part 3: Topic 10

Describe an important conversation you had in the past

Whether or not someone achieves their aims is mostly by a question of luck

International tourism creates tension rather than understanding between people from different cultures

Describe your favourite photograph

Disclaimer

The information on this site is for informational purposes only. IELTS is a registered trademark of the University of Cambridge ESOL, the British Council, and IDP Education Australia. This site and its owner are not affiliated, approved or endorsed by University of Cambridge ESOL, the British Council, or IDP Education Australia.
  • About Us
  • Contact Us
  • Disclaimer
  • Terms & Conditions
  • Privacy Policy

Copyright © 2023 9IELTS. All Rights Reserved.

No Result
View All Result
  • Listening
    • Cambridge IELTS Tests
    • IELTS Practice Tests
    • Recent Actual Tests
  • Reading
    • Cambridge IELTS Tests
    • IELTS Practice Tests
    • Recent Actual Tests
  • Speaking
    • Speaking Part 1
    • Speaking Part 2
    • Speaking Part 3
  • Writing
    • General Training Writing Task 1
    • Academic Writing Task 1
      • Bar Chart
      • Line Graph
      • Pie Chart
      • Table
      • Map
      • Process Diagram
      • Mixed Charts
    • IELTS Writing Task 2
      • Advantages & Disadvantages Essays
      • Agree or Disagree Essays
      • Discuss Both Views Essays
      • Direct Questions Essays
      • Problems/Causes & Solutions Essays
  • Grammar
  • Vocabulary
    • Speaking Vocabulary
    • Writing Vocabulary
    • Collocation for IELTS
  • IELTS Books
  • Blog

Copyright © 2023 9IELTS. All Rights Reserved.

This site uses cookies to offer you a better browsing experience. By continuing to use this website, you agree to our Privacy Policy.