• E-mail: admin@9ielts.com
  • Listening
    • IELTS Practice Tests
    • Recent Actual Tests
  • Reading
    • IELTS Practice Tests
    • Recent Actual Tests
  • Speaking
    • Speaking Part 1
    • Speaking Part 2
    • Speaking Part 3
  • Writing
    • General Training Writing Task 1
    • Academic Writing Task 1
      • Bar Chart
      • Line Graph
      • Pie Chart
      • Table
      • Map
      • Process Diagram
      • Mixed Charts
    • IELTS Writing Task 2
      • Advantages & Disadvantages Essays
      • Agree or Disagree Essays
      • Discuss Both Views Essays
      • Direct Questions Essays
      • Problems/Causes & Solutions Essays
  • Grammar
  • Vocabulary
    • Speaking Vocabulary
    • Writing Vocabulary
    • Collocations for IELTS
  • Books
  • Blog
No Result
View All Result
No Result
View All Result
Home IELTS Writing Academic Writing Task 1

The rate of smoking per 1000 people in Someland

9IELTS by 9IELTS
July 18, 2022
in Academic Writing Task 1
Reading Time: 3 mins read
7
VIEWS

» You should spend about 20 minutes on this task.

The graph below shows the rate of smoking per 1000 people in Someland from 1960 to 2000.

Write a report for a university lecturer describing the information in the graph below.

» Write at least 150 words.
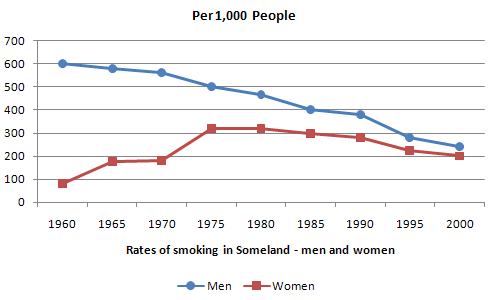
The rate of smoking per 1000 people in Someland.1

Model Answer 1:


The ratio of smokers among men and women in Someland is outlined in the line graph and the data also shows how this rate changed over a 40 years’ time. It is obvious that the ratio of smokers in Someland dipped over the time but female smokers’ percentage climbed higher.

As is visible in the illustration, almost six in ten men smoked in 1960 in Someland. At that time one female out of then smoked but over the decades this ratio went higher while the percentage of male smokers decreased. In 1970, almost 2 in every ten women smoked while male smokers’ ratio somewhat decreased. Moving further, the percentages of male and female smokers in 1985 stood at 40% and 30%, which shows a contrasting trend of smoking between men and women. It is obvious that more females started consuming tobacco in 1985 than any other time in the past. However, the smoking rate among both genders gradually decreased after 1985 and in 2000, almost 20 to 25 male and female in Someland smoked. Though more males in Someland smoked, the increasing trend of the female smokers was somewhat alarming.       

Sample Answer 2:  


The provided graph compares the male and female smokers from 1960 to 2000 in Someland. As is observed from the given presentation, over the 40 years, the number of male smokers dropped significantly while the number of female smokers increased.

Initially, in 1960, 600 males out of 1000 smoked and the female smokers were less 100 in number in this year. Over the next 40 years, the number of male smokers decreased steadily and reached to just over 200 out of 1000 people. On the contrary, though the number of female smokers was always fewer than the male smokers, their number progressed over the time. In 2000, the male and female smokers’ number got at around 200 in 1000 people.

In summary, male smokers were higher in number than female smokers from 1960 to 2000 but while the number of male smokers decreased steadily, female smoker’s number increased and in 2000, the percentage of male and female smokers got almost same.

( This model answer can be followed as an example of a very good answer. However, please note that this is just one example out of many possible approaches.)

Model Answer 3:


The line graph presents data on the male and female smokers per thousand people in Someland from 1960 to 2000. As an overall trend, it is obvious that the rate of male smoker decreased over the time while the female smokers’ rate increase in the given period of time.

According to the given line graph, the ratio of male smokers in Someland was much higher than that of females in 1960. 600 men out of 1000, smoked in this year while the ratio of women smokers was less than 100 per thousand. However, the male smokers’ percentage kept on decreasing steadily over the time and an opposite trend could be observed among the women. After 20 years the percentages or male and female smoker in Someland were 48% and 31% respectively. Finally, in 2000, the percentages of male and female smokers became almost the same. In 2000, the male smokers’ ratio was 20%, which was a significant decline in the ratio of the male smoker, while it was 20% for women, which shows that the percentage of female ration doubled in 40 years.

Previous Post

Many people want their country to host an international sporting event

Next Post

Food budget average family spent on restaurant meals

Leave a Reply Cancel reply

Your email address will not be published. Required fields are marked *

POPULAR POSTS

Cambridge IELTS 1-19 Book Series [PDF + Audio]

Cambridge IELTS 20 Academic [Update 2025]

Cambridge IELTS 19 Academic [PDF + Audio]

200 IELTS Speaking Sample Answers [PDF + Audio]

IELTS Recent Actual Tests [Full PDF + Audio]

Cambridge IELTS 18 Academic [PDF + Audio]

IELTS Listening Practice Test 204

IELTS Reading Practice Test 320

Cambridge IELTS 18 General Training [PDF + Audio]

Cambridge IELTS 17 General Training [PDF + Audio]

About Us

9ielts logo

9IELTS is dedicated to providing free materials and resources for IELTS conquerors. Stay constantly updated with a wide range of ultimate tips, strategies, and practice tests to crack the high-stakes IELTS exam!

Recent Posts

Describe something you want to do in the future

Describe a TV documentary

Private cars on the roads in many parts of the world has led to serious problems.

Students who are proficient in a foreign language

You have a friend who is about to enter university

Disclaimer

The information on this site is for informational purposes only. IELTS is a registered trademark of the University of Cambridge ESOL, the British Council, and IDP Education Australia. This site and its owners are not affiliated, approved or endorsed by University of Cambridge ESOL, the British Council, or IDP Education Australia.
  • About Us
  • Contact Us
  • Disclaimer
  • Terms & Conditions
  • Privacy Policy

© 2024 9IELTS. All Rights Reserved.

No Result
View All Result
  • Listening
    • IELTS Practice Tests
    • Recent Actual Tests
  • Reading
    • IELTS Practice Tests
    • Recent Actual Tests
  • Speaking
    • Speaking Part 1
    • Speaking Part 2
    • Speaking Part 3
  • Writing
    • General Training Writing Task 1
    • Academic Writing Task 1
      • Bar Chart
      • Line Graph
      • Pie Chart
      • Table
      • Map
      • Process Diagram
      • Mixed Charts
    • IELTS Writing Task 2
      • Advantages & Disadvantages Essays
      • Agree or Disagree Essays
      • Discuss Both Views Essays
      • Direct Questions Essays
      • Problems/Causes & Solutions Essays
  • Grammar
  • Vocabulary
    • Speaking Vocabulary
    • Writing Vocabulary
    • Collocations for IELTS
  • Books
  • Blog

© 2024 9IELTS. All Rights Reserved.