• E-mail: admin@9ielts.com
  • Listening
    • IELTS Practice Tests
    • Recent Actual Tests
  • Reading
    • IELTS Practice Tests
    • Recent Actual Tests
  • Speaking
    • Speaking Part 1
    • Speaking Part 2
    • Speaking Part 3
  • Writing
    • General Training Writing Task 1
    • Academic Writing Task 1
      • Bar Chart
      • Line Graph
      • Pie Chart
      • Table
      • Map
      • Process Diagram
      • Mixed Charts
    • IELTS Writing Task 2
      • Advantages & Disadvantages Essays
      • Agree or Disagree Essays
      • Discuss Both Views Essays
      • Direct Questions Essays
      • Problems/Causes & Solutions Essays
  • Grammar
  • Vocabulary
    • Speaking Vocabulary
    • Writing Vocabulary
    • Collocations for IELTS
  • Books
  • Blog
No Result
View All Result
No Result
View All Result
Home IELTS Writing

The total US population aged 65 and over between 1900 and 2000

9IELTS by 9IELTS
July 16, 2022
in IELTS Writing, Academic Writing Task 1, Bar Chart
Reading Time: 3 mins read
28
VIEWS

You should spend about 20 minutes on this task.

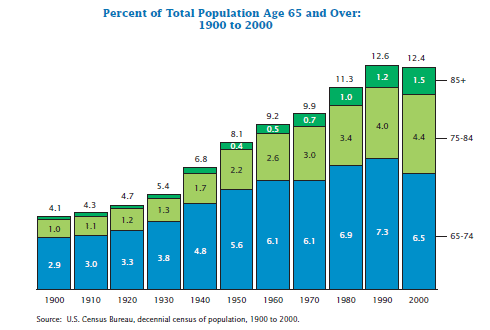
The chart below shows the percentage of the total US population aged 65 and over between 1900 and 2000. Summarise the information by selecting and reporting the main features, and make comparisons where relevant.

You should write at least 150 words.

Percent of the Total Population age 65 and over between 1900 to 2000 in the USA.

Sample Answer 1

The column graph summarises the percentages of elderly citizens in the USA who were above 64 years old between 1900 and 2000 based on the U.S. Census Bureau’s decennial census of population data.

Generally speaking, the ratio of senior citizens in the USA increased significantly over the period, and 65 to 74 years old citizens were the highest in percentage in terms of their ratio among elderly Americans.

According to the graph, four out of a hundred Americans were above 64 years old in 1900, most of whom were between 65 to 74 years old. Moreover, this decade’s ratio of people over 85 years old was very insignificant. After three decades, however, the elderly people ratio in the US reached over 5% and kept increasing until the end of the 20th century. Thus, almost one in ten US citizens was elderly in 1970, and 0.7% of them were 85 years old. The growth of senior citizens further accelerated after 1980 in the USA. Consequently, during the last two decades of the 20th century, the USA had been the home to 12% of senior citizens; almost 4.5% were between 75 to 84 years old, and 1.5% were above 85 years old.

Sample Answer 2

The column graph depicts the percentages of senior citizens in the USA throughout the 20th century according to the decennial census population data of the U.S. Census Bureau.

Generally speaking, elderly people in the USA increased from 1900 to 2000. 65 to 74 years old citizens were the highest percentage of elderly Americans during this time.

As can be seen in the chart, four out of every hundred Americans were over 64 years old in 1900. Moreover, this year’s ratio of people over 85 years old was insignificant. During the first three decades, the percentage of elderly people in the USA increased by merely 1%, and there was no change in the rate of citizens aged over 85 years.

Then in the next sixty years, the percentage of senior citizens surged to a maximum of over 12% of the total population. However, the number dropped slightly in the last ten years of the century. By 2000, most elderly people were between 65 to 74, which was 6.5%, and the citizens aged 85+ were only 1.5%.

Sample Answer 3

The chart shows the percentage of total population aged 65 and over in the U.S. between 1900 and 2000. In the year 1900 just over 4% of the population was aged over 65. However, by 1960 this figure had doubled.

The number of people aged between 75 and 84 remained fairly steady between 1900 and 1930, making up only 1-1.3% of the population. The figure began to rise more significantly in 1940 and by 1970 it had tripled to reach 3% of the population.

Although there was no change in the number of people aged 65 -74 between 1960 and 1970, the number of people aged 75 and over increased during this time. By the year 2000, 12.4% of the US population had reached the age of 65 or more, although this was slightly lower than in 1990 when it peaked at 12.6%.

The chart shows that today people in the U.S. can expect to live longer than in 1900. By the year 2000 more than 12% of the population had managed to live to the age of 65 and over compared to only 4.1% in 1900.

Previous Post

 Passengers travelling by train in Sydney and trains running on time

Next Post

Average percentages in typical meals of three types of nutrients

Leave a Reply Cancel reply

Your email address will not be published. Required fields are marked *

POPULAR POSTS

Cambridge IELTS 1-19 Book Series [PDF + Audio]

Cambridge IELTS 20 Academic [Update 2025]

Cambridge IELTS 19 Academic [PDF + Audio]

200 IELTS Speaking Sample Answers [PDF + Audio]

Cambridge IELTS 18 Academic [PDF + Audio]

IELTS Recent Actual Tests [Full PDF + Audio]

IELTS Listening Practice Test 204

Cambridge IELTS 18 General Training [PDF + Audio]

IELTS Reading Practice Test 320

Cambridge IELTS 17 General Training [PDF + Audio]

About Us

9ielts logo

9IELTS is dedicated to providing free materials and resources for IELTS conquerors. Stay constantly updated with a wide range of ultimate tips, strategies, and practice tests to crack the high-stakes IELTS exam!

Recent Posts

Describe an important event in global history

It is more important for students to study history and literature than it is for them to study science and mathematics

The changes that took place in three different areas of crime in Panama City

Increasing the price of the petrol is the best solution to traffic jam

The picture below shows a hot balloon works

Disclaimer

The information on this site is for informational purposes only. IELTS is a registered trademark of the University of Cambridge ESOL, the British Council, and IDP Education Australia. This site and its owners are not affiliated, approved or endorsed by University of Cambridge ESOL, the British Council, or IDP Education Australia.
  • About Us
  • Contact Us
  • Disclaimer
  • Terms & Conditions
  • Privacy Policy

© 2024 9IELTS. All Rights Reserved.

No Result
View All Result
  • Listening
    • IELTS Practice Tests
    • Recent Actual Tests
  • Reading
    • IELTS Practice Tests
    • Recent Actual Tests
  • Speaking
    • Speaking Part 1
    • Speaking Part 2
    • Speaking Part 3
  • Writing
    • General Training Writing Task 1
    • Academic Writing Task 1
      • Bar Chart
      • Line Graph
      • Pie Chart
      • Table
      • Map
      • Process Diagram
      • Mixed Charts
    • IELTS Writing Task 2
      • Advantages & Disadvantages Essays
      • Agree or Disagree Essays
      • Discuss Both Views Essays
      • Direct Questions Essays
      • Problems/Causes & Solutions Essays
  • Grammar
  • Vocabulary
    • Speaking Vocabulary
    • Writing Vocabulary
    • Collocations for IELTS
  • Books
  • Blog

© 2024 9IELTS. All Rights Reserved.