• E-mail: admin@9ielts.com
  • Listening
    • IELTS Practice Tests
    • Recent Actual Tests
  • Reading
    • IELTS Practice Tests
    • Recent Actual Tests
  • Speaking
    • Speaking Part 1
    • Speaking Part 2
    • Speaking Part 3
  • Writing
    • General Training Writing Task 1
    • Academic Writing Task 1
      • Bar Chart
      • Line Graph
      • Pie Chart
      • Table
      • Map
      • Process Diagram
      • Mixed Charts
    • IELTS Writing Task 2
      • Advantages & Disadvantages Essays
      • Agree or Disagree Essays
      • Discuss Both Views Essays
      • Direct Questions Essays
      • Problems/Causes & Solutions Essays
  • Grammar
  • Vocabulary
    • Speaking Vocabulary
    • Writing Vocabulary
    • Collocations for IELTS
  • Books
  • Blog
No Result
View All Result
No Result
View All Result
Home IELTS Writing

 Passengers travelling by train in Sydney and trains running on time

9IELTS by 9IELTS
July 16, 2022
in IELTS Writing, Academic Writing Task 1, Line Graph
Reading Time: 2 mins read
23
VIEWS

You should spend about 20 minutes on this task.

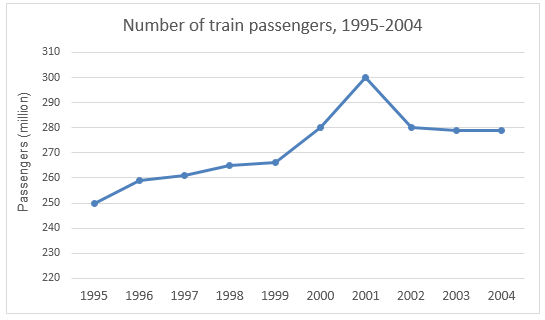
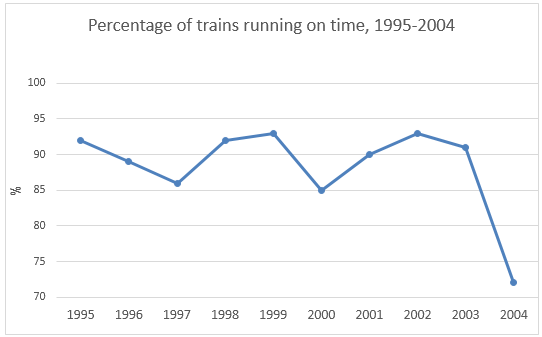
The first graph gives the number of passengers travelling by train in Sydney. The second graph provides information on the percentage of trains running on time. Summarise the information by selecting and reporting the main features, and make comparisons where relevant.

You should write at least 150 words.

 Passengers travelling by train in Sydney and trains running on time.1
 Passengers travelling by train in Sydney and trains running on time.2

Sample Answer


The line graphs give data on the number of train commuters in Sydney from 1995 to 2004 and outline the ratio of trains that ran on time during the same period. As an overall trend, the number of rail passengers in Sydney gradually increased between 1995 to 2002 and in 2004 a higher percentage of locomotives failed to run on time.

As the data suggests, 250 million passengers used the train transportations in 1995 in Sydney and this number slowly increased in the next 4 years. In 1999, train commuters’ number in Sydney was around 265 million and it abruptly hiked in the next two years before dropping again in 2002. In 2000, 280 million passengers used locomotives and this number further increased and reached to the highest, 300 million, in 2001. From 2002 to 2004 the train commuters’ number remained constant at 280 million.

Besides, more than 92% trains in 1995 arrived and reached their destination on time but this record deteriorated and dropped to just over 85% in 1997. In 2000, almost 15% rails failed to maintain the schedule and this scenario was worst in 2004 when more than 25% trains in Sydney could not run on time.

Previous Post

How people in a European city reached their office and got back home

Next Post

The total US population aged 65 and over between 1900 and 2000

Leave a Reply Cancel reply

Your email address will not be published. Required fields are marked *

POPULAR POSTS

Cambridge IELTS 1-19 Book Series [PDF + Audio]

Cambridge IELTS 20 Academic [Update 2025]

Cambridge IELTS 19 Academic [PDF + Audio]

200 IELTS Speaking Sample Answers [PDF + Audio]

Cambridge IELTS 18 Academic [PDF + Audio]

IELTS Recent Actual Tests [Full PDF + Audio]

IELTS Listening Practice Test 204

Cambridge IELTS 18 General Training [PDF + Audio]

IELTS Reading Practice Test 320

Cambridge IELTS 17 General Training [PDF + Audio]

About Us

9ielts logo

9IELTS is dedicated to providing free materials and resources for IELTS conquerors. Stay constantly updated with a wide range of ultimate tips, strategies, and practice tests to crack the high-stakes IELTS exam!

Recent Posts

Describe a Time When You Helped a Stranger 

It is wise to spent more money to prevent illness than to spend on curing

IELTS Listening Practice Test 106

Very few schoolchildren learn about the value of money and how to look after it

Describe a family business which is successful

Disclaimer

The information on this site is for informational purposes only. IELTS is a registered trademark of the University of Cambridge ESOL, the British Council, and IDP Education Australia. This site and its owners are not affiliated, approved or endorsed by University of Cambridge ESOL, the British Council, or IDP Education Australia.
  • About Us
  • Contact Us
  • Disclaimer
  • Terms & Conditions
  • Privacy Policy

© 2024 9IELTS. All Rights Reserved.

No Result
View All Result
  • Listening
    • IELTS Practice Tests
    • Recent Actual Tests
  • Reading
    • IELTS Practice Tests
    • Recent Actual Tests
  • Speaking
    • Speaking Part 1
    • Speaking Part 2
    • Speaking Part 3
  • Writing
    • General Training Writing Task 1
    • Academic Writing Task 1
      • Bar Chart
      • Line Graph
      • Pie Chart
      • Table
      • Map
      • Process Diagram
      • Mixed Charts
    • IELTS Writing Task 2
      • Advantages & Disadvantages Essays
      • Agree or Disagree Essays
      • Discuss Both Views Essays
      • Direct Questions Essays
      • Problems/Causes & Solutions Essays
  • Grammar
  • Vocabulary
    • Speaking Vocabulary
    • Writing Vocabulary
    • Collocations for IELTS
  • Books
  • Blog

© 2024 9IELTS. All Rights Reserved.