• E-mail: admin@9ielts.com
  • Listening
    • IELTS Practice Tests
    • Recent Actual Tests
  • Reading
    • IELTS Practice Tests
    • Recent Actual Tests
  • Speaking
    • Speaking Part 1
    • Speaking Part 2
    • Speaking Part 3
  • Writing
    • General Training Writing Task 1
    • Academic Writing Task 1
      • Bar Chart
      • Line Graph
      • Pie Chart
      • Table
      • Map
      • Process Diagram
      • Mixed Charts
    • IELTS Writing Task 2
      • Advantages & Disadvantages Essays
      • Agree or Disagree Essays
      • Discuss Both Views Essays
      • Direct Questions Essays
      • Problems/Causes & Solutions Essays
  • Grammar
  • Vocabulary
    • Speaking Vocabulary
    • Writing Vocabulary
    • Collocations for IELTS
  • Books
  • Blog
No Result
View All Result
No Result
View All Result
Home IELTS Writing

How people in a European city reached their office and got back home

9IELTS by 9IELTS
July 16, 2022
in IELTS Writing, Academic Writing Task 1, Pie Chart
Reading Time: 2 mins read
28
VIEWS

You should spend about 20 minutes on this task.

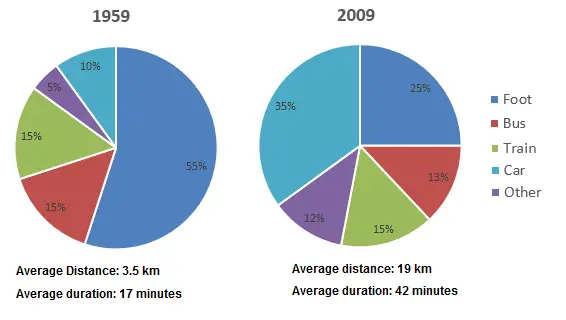
The graphs below show how people in a European city reached their office and got back home in 1959 and 2009. Summarise the information by selecting and reporting the main features, and make comparisons where relevant.

You should write at least 150 words.  

Journeys to and from work
How people in a European city reached their office and got back home

Sample Answer

The pie charts delineate how citizens in a European city commuted to and from their offices in 1959 and 2009. Overall, more than half of the office-goers walked in 1959 while car use in 2009 significantly increased. Besides, people travelled more distance in 2009 at a faster speed.

According to the illustration, more than half of the job holders walked to reach their office and get back home in 1959 while only a quarter of them did so in 2009. Bus commuters in this city accounted for 15% in 1959 while it was 2% less after 5 decades. The ratio of office executives (15%) who used trains in both years remained the same. One in ten office commuters drove cars in 1959 but after five decades their percentage increased significantly, 35% to be exact. The use of different other transportations in 2009 increased than that of 50 years earlier.

It is worth noticing that the speed and average distance travelled by these commuters considerably increased in 2009 when a commuter travelled 19 kilometres on an average in 42 minutes compared to their average 3.5-kilometre journey in 17 minutes in 1959.

Previous Post

Consumption and production of potatoes in five parts of the world

Next Post

 Passengers travelling by train in Sydney and trains running on time

Leave a Reply Cancel reply

Your email address will not be published. Required fields are marked *

POPULAR POSTS

Cambridge IELTS 1-19 Book Series [PDF + Audio]

Cambridge IELTS 20 Academic [Update 2025]

Cambridge IELTS 19 Academic [PDF + Audio]

200 IELTS Speaking Sample Answers [PDF + Audio]

IELTS Recent Actual Tests [Full PDF + Audio]

Cambridge IELTS 18 Academic [PDF + Audio]

IELTS Listening Practice Test 204

IELTS Reading Practice Test 320

Cambridge IELTS 18 General Training [PDF + Audio]

Cambridge IELTS 17 General Training [PDF + Audio]

About Us

9ielts logo

9IELTS is dedicated to providing free materials and resources for IELTS conquerors. Stay constantly updated with a wide range of ultimate tips, strategies, and practice tests to crack the high-stakes IELTS exam!

Recent Posts

The underground railway systems in six cities

Communicate either professionally or socially using technology

Many jobs require ongoing training and research to stay competitive

IELTS Listening Practice Test 36

Information about sales and share prices for Coca-Cola

Disclaimer

The information on this site is for informational purposes only. IELTS is a registered trademark of the University of Cambridge ESOL, the British Council, and IDP Education Australia. This site and its owners are not affiliated, approved or endorsed by University of Cambridge ESOL, the British Council, or IDP Education Australia.
  • About Us
  • Contact Us
  • Disclaimer
  • Terms & Conditions
  • Privacy Policy

© 2024 9IELTS. All Rights Reserved.

No Result
View All Result
  • Listening
    • IELTS Practice Tests
    • Recent Actual Tests
  • Reading
    • IELTS Practice Tests
    • Recent Actual Tests
  • Speaking
    • Speaking Part 1
    • Speaking Part 2
    • Speaking Part 3
  • Writing
    • General Training Writing Task 1
    • Academic Writing Task 1
      • Bar Chart
      • Line Graph
      • Pie Chart
      • Table
      • Map
      • Process Diagram
      • Mixed Charts
    • IELTS Writing Task 2
      • Advantages & Disadvantages Essays
      • Agree or Disagree Essays
      • Discuss Both Views Essays
      • Direct Questions Essays
      • Problems/Causes & Solutions Essays
  • Grammar
  • Vocabulary
    • Speaking Vocabulary
    • Writing Vocabulary
    • Collocations for IELTS
  • Books
  • Blog

© 2024 9IELTS. All Rights Reserved.