• E-mail: admin@9ielts.com
  • Listening
    • IELTS Practice Tests
    • Recent Actual Tests
  • Reading
    • IELTS Practice Tests
    • Recent Actual Tests
  • Speaking
    • Speaking Part 1
    • Speaking Part 2
    • Speaking Part 3
  • Writing
    • General Training Writing Task 1
    • Academic Writing Task 1
      • Bar Chart
      • Line Graph
      • Pie Chart
      • Table
      • Map
      • Process Diagram
      • Mixed Charts
    • IELTS Writing Task 2
      • Advantages & Disadvantages Essays
      • Agree or Disagree Essays
      • Discuss Both Views Essays
      • Direct Questions Essays
      • Problems/Causes & Solutions Essays
  • Grammar
  • Vocabulary
    • Speaking Vocabulary
    • Writing Vocabulary
    • Collocations for IELTS
  • Books
  • Blog
No Result
View All Result
No Result
View All Result
Home IELTS Writing

Thefts per thousand vehicles in four countries

9IELTS by 9IELTS
July 16, 2022
in IELTS Writing, Academic Writing Task 1, Line Graph
Reading Time: 2 mins read
20
VIEWS

You should spend about 20 minutes on this task.

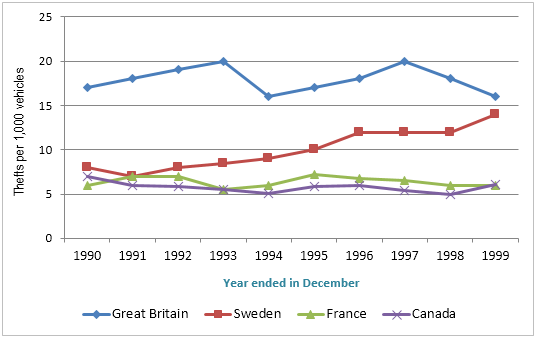
The line graph shows thefts per thousand vehicles in four countries between 1990 and 1999. Summarize the information by selecting and reporting the main features, and make comparisons where relevant.

You should write at least 150 words.

Thefts per thousand vehicles in four countries

Sample Answer

The line graph presents data on vehicle theft cases in Great Britain, Sweden, France and Canada from 1990 to 1999. As is obvious, car thefts in Great Britain were higher than that of other countries while this rate noticeably increased in Sweden.

According to the diagram, roughly 17 transportations in every thousand were stolen in the Great Britain in 1990 while this rate was between 6 to 8 per thousand in France, Canada and Sweden. Automobile embezzlement in Great Britain steadily climbed till 1993 at which point 2% cars were reported abducted. With some minor fluctuations, car lifting rates in France and Canada remained almost constant throughout the years. In contrast, carrier stealing rate in Sweden kept on soaring and in 1995 this proportion reached as high as 10 in every thousand vehicles. Motor vehicle theft in Great Britain sharply declined in 1994 but grew again till 1997 to strike 2% again. Afterwards, car theft incidents in Great Britain firmly declined between 1997 and 1999 when it actually increased in Sweden. Finally, in 1999, almost 1.5% automobiles in Great Britain and Sweden were reported stolen while it was almost one-third of that in France and Canada.

Previous Post

Sales of trainers made by a sportswear company

Next Post

GDP in four countries in billions of US dollar

Leave a Reply Cancel reply

Your email address will not be published. Required fields are marked *

POPULAR POSTS

Cambridge IELTS 1-19 Book Series [PDF + Audio]

Cambridge IELTS 20 Academic [Update 2025]

Cambridge IELTS 19 Academic [PDF + Audio]

200 IELTS Speaking Sample Answers [PDF + Audio]

IELTS Recent Actual Tests [Full PDF + Audio]

Cambridge IELTS 18 Academic [PDF + Audio]

IELTS Listening Practice Test 204

IELTS Reading Practice Test 320

Cambridge IELTS 18 General Training [PDF + Audio]

Cambridge IELTS 17 General Training [PDF + Audio]

About Us

9ielts logo

9IELTS is dedicated to providing free materials and resources for IELTS conquerors. Stay constantly updated with a wide range of ultimate tips, strategies, and practice tests to crack the high-stakes IELTS exam!

Recent Posts

Destinations of holiday makers from a particular Asian country

Describe a skill that you can teach other people

Describe a childhood teacher whom you want to meet

Describe a house that someone you know has recently bought

Describe something important for maintaining a healthy lifestyle

Disclaimer

The information on this site is for informational purposes only. IELTS is a registered trademark of the University of Cambridge ESOL, the British Council, and IDP Education Australia. This site and its owners are not affiliated, approved or endorsed by University of Cambridge ESOL, the British Council, or IDP Education Australia.
  • About Us
  • Contact Us
  • Disclaimer
  • Terms & Conditions
  • Privacy Policy

© 2024 9IELTS. All Rights Reserved.

No Result
View All Result
  • Listening
    • IELTS Practice Tests
    • Recent Actual Tests
  • Reading
    • IELTS Practice Tests
    • Recent Actual Tests
  • Speaking
    • Speaking Part 1
    • Speaking Part 2
    • Speaking Part 3
  • Writing
    • General Training Writing Task 1
    • Academic Writing Task 1
      • Bar Chart
      • Line Graph
      • Pie Chart
      • Table
      • Map
      • Process Diagram
      • Mixed Charts
    • IELTS Writing Task 2
      • Advantages & Disadvantages Essays
      • Agree or Disagree Essays
      • Discuss Both Views Essays
      • Direct Questions Essays
      • Problems/Causes & Solutions Essays
  • Grammar
  • Vocabulary
    • Speaking Vocabulary
    • Writing Vocabulary
    • Collocations for IELTS
  • Books
  • Blog

© 2024 9IELTS. All Rights Reserved.