» You should spend about 20 minutes on this task.
The charts below give information about USA marriage and divorce rates between 1970 and 2000, and the marital status of adult Americans in two of the years.
Summarise the information by selecting and reporting the main features, and make comparisons where relevant.
» Write at least 150 words.
Sample Answer 1
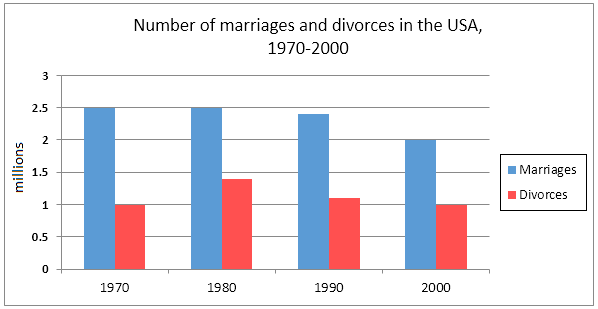
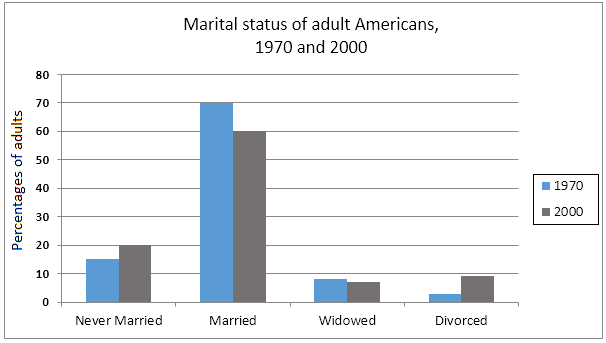
The first chart illustrates the change in the number of marriages and divorces in the US over a 30-year period from 1970. The second chart compares the proportion of American adults’ different marital statuses in two years, 1970 and 2000.
Overall, there was a clear downward trend of people getting married in the US. Although a majority of adult Americans were married in both recorded years, there was a quite higher percentage of people staying single in 2000.
From 1970 to 1980, 2.5 million marriages were registered in America; however, this number gradually decreased to 2 million by the year 2000. In contrast, the number of divorces filed was around 1 million in 1970 and then reached a peak at almost 1.5 million a decade later. There had been since then fewer divorces and the figure fell back to 1 million in 2000, exactly 50% of that of the marriages in the same year.
The percentage of married American adults dropped from 70% in 1970 to around 60% in 2000. Similarly, there was a marginal decrease in the proportion of widowed people. The figures for never-married people and divorced ones experienced a slight rise, by around 8% for each category.
[ written by – Quinn ]
Sample Answer 2
The given bar graphs show data on the marriage and divorce rate in the USA from 1970 to 2000 and also show the marital statuses of the US citizens in these two years.
According to the first bat graph, the marriage rate in 1970 & 1980 was 2.5 million and this rate decreased to 2 million in the year 2000. On the contrary, the divorce rate in the USA was 1 million in 1970 and this rate increased to almost 1.5 million in 1980 and after that, it kept decreased to around 1 million again in the year 2000.
From the second graph, we can observe that in 1970 70% of adults were married while less than 15% never got married. The percentage of widowed and divorced people were less than 10% in this year. After 30 years, in 2000, the percentages of the married population decreased by 10% and the percentage of people who either never got married or got divorced increased.
Sample Answer 3
The provided charts compare the rate of marriage and divorce and marital status of adults Americans between 1970 and 2000.
As can be observed, marriage in 1970 and 1980 remained unchanged, but after that, it started falling. In 1970 and 1980, there were 2.5 million marriages, equally. However, it decreased to almost 2.3 million in 1990 and 2 million in 2000 respectively. The lowest divorce rate was recorded in 1970 and 2000 with 1 million marriages in both years. Highest divorce (1.4 million) occurred in 1990, which decreased significantly to 1.1 million in 1990.
It is noticeable that, in 1970, highest proportions of adult Americans, precisely 70%, were married. On the other hand, 59% were married in 2000. Lowest divorce percentage was recorded at 2% and 8% in 1970 and 2000 respectively in both years. Overall, the number of people getting married had decreased with an increased divorce rate in 2000 in the USA.
[ written by – Vivek Sharma Dhakal ]
Sample Answer 4
The given bar graphs show information about marriage and divorce rate of USA from 1970 to 2000 and also illustrate marital status in two years 1970 and 2000.
According to the first bar graph, as it can be seen clearly, initially marriage rate of USA was 2.5 million in the year 1970 which remained constant after one decade and started receding slightly afterwards. The total marriage rate in the USA remained exactly 2 million in the year 2000 respectively.
On contrary, as is observed from the bar chart, in 1970 divorce rate was one million which magnified to 1.4 million after a decade but again dropping trend can be seen. And finally, divorce rate slumped to one million which was its initial state.
On the other hand, as is presented in another bar graph, in 1970 total adult people were married by 70% while 15 % never got married. Widowed and divorced status remained just under 10% in 1970 which dropped to 3% approximately in the year 2000. Divorce status increased but remained under 10% but very close to 10%.
[ Written by – Faisal Ali ]