» You should spend about 20 minutes on this task.
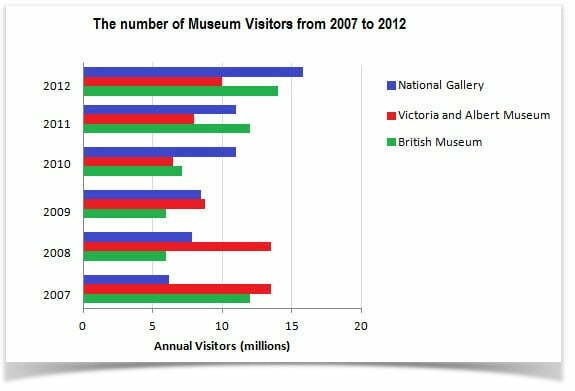
The bar chart shows the number of visitors to three London Museums between 2007 and 2012. Summarise the information by selecting and reporting the main features, and make comparisons where relevant.
» Write at least 150 words
Sample Answer 1
The bar graph compares visitors to three museums in London from 2007 to 2012. Generally speaking, National Gallery and the British museums attracted the most significant number of spectators in 2012 though Victoria and Albert Museum was more prevalent in the early years.
As the data suggests, National Gallery received the least visitors (roughly 6 million) in 2007, and its visitors gradually progressed to make it the most visited museum in London in 2012. Approximately 16 million people went to enjoy National Gallery in 2012.
Victoria and Albert Museum had the most significant fans in 2007 as almost 13 million people toured it. It was the most famous museum among the three both in 2007 and 2008 but sharply lost the battle of visitors’ number. From 2010 to 2012, this museum was attended by the least number of spectators.
Finally, the British Museum was the second most famous museum in 2007 with its nearly 12 million fans but its visitors’ number declined in the subsequent three years. In 2011, it was the most attended museum in London in regards to visitor’s number but it became the second most toured museum next year with roughly 14 million visitants.
Sample Answer 2
The bar graph compares museum visitors to three different types of museums in London from 2007 to 2012. As is presented in the graph, the National Gallery got more popular over time and the highest number of people visited those museums in 2012.
According to the diagram, initially in 2007, more than 12 million people visited the British Museum while this number was more than 13 million for Victoria and Albert Museum and only 6.5 million for the National Gallery. The popularity of Victoria and Albert museum remain almost the same next year while it declined for other two museums. The National Gallery Museum got a higher number of visitors each year while the total number of visitors decreased in 2009, 2010 and in 2011.
Finally, in 2012, the National Gallery attracted the largest segment of visitors, amounting over 15 million, while the British Museum was visited by roughly 13 million people. 10 million guests attended Victoria and Albert Museum at that time.
In summary, National Gallery gained popularity over the time and more people visited the London Museums in 2007 and in 2012 than they did in the years in between.
Sample Answer 3
The illustration depicts the number of visitors in three London museums namely – National Gallery, Victoria and Albert Museum and British Museum, over half of a decade, between 2007 and 2012. It is apparent that a higher number of people visited the Victoria and Albert Museum in 2007 but in 2012 the National Museum became the most attended Museum.
As is presented, 12.5, 14 and 6 million visitors enjoyed the British, Victoria and Albert and National Gallery museums consequently in 2007. The spectators’ number in the Victoria and Albert Museum remained almost the same next year but the fans of British Museum plunged remarkably. On the contrary, the number of people who preferred to visit the National Museum kept on growing steadily. This growth for the National Gallery continued each year and it became the most attended museum in 2012 with around 17 million visitants.
The spectator’s numbers for the Victoria and Albert Museum oscillated during these years and after a huge fall in 2010, the number of its visitors swelled up monotonously and reached to 10 million in the final year. The trend of visitors in the British Museum was somewhat similar to the Victoria and Albert museum visitors which ended up being the second most famous museum in 2012 with around 14 million guests.
[Written by – Nima]
Sample Answer 4
The diagram compares the visitors’ number to three museums in London between 2007 and 2012. Overall, National Gallery, despite its least popularity in early years, managed to become the most-visited museum in London in 2012.
As is presented in the diagram, Victoria and Albert Museum received the highest number of visitants in 2007, roughly 13 million. At that time, National Gallery and the British Museum received 6 and 12 million spectators respectively. During the next two years, Victoria and Albert Museum enjoyed its first position in visitors’ number, but it was closely tied to the National Gallery in 2009. This year all three museums were visited by the least number of people, around 8 million to National Gallery and Victoria and Albert Museum and only 6 million to the British Museum.
The highest number of people (approximately 11.5 million) visited the National Gallery in 2010 and other two museums attracted 6-7 million fans. In 2012, National Gallery became the most popular museum in London with roughly 16 million observers. The British Museum in this year sold tickets to nearly 14 million people and the least visitants preferred the Victoria and Albert Museum during this time.