• E-mail: admin@9ielts.com
  • Listening
    • Cambridge IELTS Tests
    • IELTS Practice Tests
    • Recent Actual Tests
  • Reading
    • Cambridge IELTS Tests
    • IELTS Practice Tests
    • Recent Actual Tests
  • Speaking
    • Speaking Part 1
    • Speaking Part 2
    • Speaking Part 3
  • Writing
    • General Training Writing Task 1
    • Academic Writing Task 1
      • Bar Chart
      • Line Graph
      • Pie Chart
      • Table
      • Map
      • Process Diagram
      • Mixed Charts
    • IELTS Writing Task 2
      • Advantages & Disadvantages Essays
      • Agree or Disagree Essays
      • Discuss Both Views Essays
      • Direct Questions Essays
      • Problems/Causes & Solutions Essays
  • Grammar
  • Vocabulary
    • Speaking Vocabulary
    • Writing Vocabulary
    • Collocation for IELTS
  • IELTS Books
  • Blog
No Result
View All Result
No Result
View All Result
Home IELTS Writing

Shares of expenditures for five major categories

9IELTS by 9IELTS
October 17, 2022
in IELTS Writing, Academic Writing Task 1, Bar Chart
Reading Time: 2 mins read
69
VIEWS

You should spend about 20 minutes on this task.

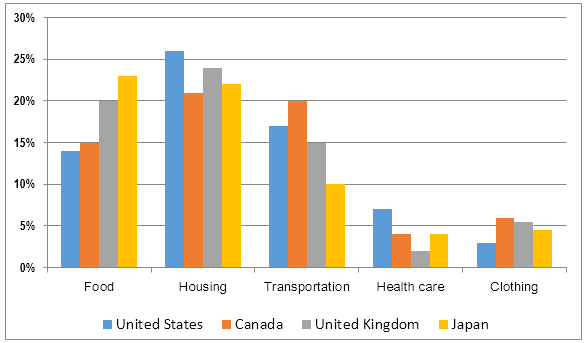
The bar chart below shows shares of expenditures for five major categories in the United States, Canada, the United Kingdom, and Japan in the year 2009. Summarise the information by selecting and reporting the main features, and make comparisons where relevant.

Write at least 150 words.

Shares of expenditures for five major categories

Read the following sample answer. Complete the answer by filling the gaps with the words in the box.

by contrast indicates lowest compares overall whereas

except higher highest however largest among

The bar chart  how consumers in the United States, Canada, the United Kingdom, and Japan allocated different shares of total spending to categories such as food, housing, and transportation in 2009.

We can see that the United States had the  housing expenditure share, 26% of total expenditures in 2009. The United Kingdom and Japan followed, with 24% and 22%, respectively. Canada had the  housing share at 21%. Housing was the  expenditure component in all countries  Japan.

, Canada had the largest transportation share of all four countries at 20%. The United States and the United Kingdom had the next-highest transportation shares, 17% and 15%, respectively. Japan had the lowest, at 10%.

, in Japan, consumers spent 23% of their total expenditures on food in 2009. The United Kingdom had the second-highest share at 20%. Canada, with 15%, and the United States, with 14% had the lowest food expenditure shares among the countries studied.

, the data  that housing and health care shares of total expenditures were  in the United States than in Canada, the United Kingdom, and Japan in 2009,  Americans had the lowest clothing share. Canada had the highest clothing and transportation shares, and Japan had the highest food share,  the countries compared.

(214 words)

Previous Post

Two possible sites for the school

Next Post

The percentage change in the share of international students among university graduates in different Canadian provinces

Leave a Reply Cancel reply

Your email address will not be published. Required fields are marked *

POPULAR POSTS

Government should make more efforts to promote alternative sources of energy

Describe an aspect of modern society that you dislike

The worldwide market share of the notebook computer market for manufacturers

Visitors to other countries should follow local customs

Describe a foreign musical festival that you enjoyed

Describe an unusual or interesting thing you did recently

You are employed full-time and also doing a part-time evening course

Describe a situation that made you a little angry

Describe a service that you received for free

Young people should spend more time on cultural activities

About Us

9ielts-logo

9IELTS is dedicated to providing free materials and resources for IELTS conquerors. Stay constantly updated with a wide range of ultimate tips, strategies, and practice tests to crack the high-stakes IELTS exam!

Recent Posts

You are applying for a job and need a letter of reference

Waste recycling rates in the US

Describe the environmental pollution in your city

Describe an experience when you played an indoor game with others

Number of fishers and the world’s top exporters of fish

Disclaimer

The information on this site is for informational purposes only. IELTS is a registered trademark of the University of Cambridge ESOL, the British Council, and IDP Education Australia. This site and its owner are not affiliated, approved or endorsed by University of Cambridge ESOL, the British Council, or IDP Education Australia.
  • About Us
  • Contact Us
  • Disclaimer
  • Terms & Conditions
  • Privacy Policy

© 2023 9IELTS. All Rights Reserved.

No Result
View All Result
  • Listening
    • Cambridge IELTS Tests
    • IELTS Practice Tests
    • Recent Actual Tests
  • Reading
    • Cambridge IELTS Tests
    • IELTS Practice Tests
    • Recent Actual Tests
  • Speaking
    • Speaking Part 1
    • Speaking Part 2
    • Speaking Part 3
  • Writing
    • General Training Writing Task 1
    • Academic Writing Task 1
      • Bar Chart
      • Line Graph
      • Pie Chart
      • Table
      • Map
      • Process Diagram
      • Mixed Charts
    • IELTS Writing Task 2
      • Advantages & Disadvantages Essays
      • Agree or Disagree Essays
      • Discuss Both Views Essays
      • Direct Questions Essays
      • Problems/Causes & Solutions Essays
  • Grammar
  • Vocabulary
    • Speaking Vocabulary
    • Writing Vocabulary
    • Collocation for IELTS
  • IELTS Books
  • Blog

© 2023 9IELTS. All Rights Reserved.

This site uses cookies to offer you a better browsing experience. By continuing to use this website, you agree to our Privacy Policy.