• E-mail: [email protected]
  • Listening
    • Cambridge IELTS Tests
    • IELTS Practice Tests
    • Recent Actual Tests
  • Reading
    • Cambridge IELTS Tests
    • IELTS Practice Tests
    • Recent Actual Tests
  • Speaking
    • Speaking Part 1
    • Speaking Part 2
    • Speaking Part 3
  • Writing
    • General Training Writing Task 1
    • Academic Writing Task 1
      • Bar Chart
      • Line Graph
      • Pie Chart
      • Table
      • Map
      • Process Diagram
      • Mixed Charts
    • IELTS Writing Task 2
      • Advantages & Disadvantages Essays
      • Agree or Disagree Essays
      • Discuss Both Views Essays
      • Direct Questions Essays
      • Problems/Causes & Solutions Essays
  • Grammar
  • Vocabulary
    • Speaking Vocabulary
    • Writing Vocabulary
    • Collocation for IELTS
  • IELTS Books
  • Blog
No Result
View All Result
No Result
View All Result
Home IELTS Writing

Waste recycling rates in the U.S. from 1960 to 2011

9IELTS by 9IELTS
August 1, 2022
in IELTS Writing, Academic Writing Task 1, Line Graph
Reading Time: 2 mins read
10
VIEWS

You should spend about 20 minutes on this task.

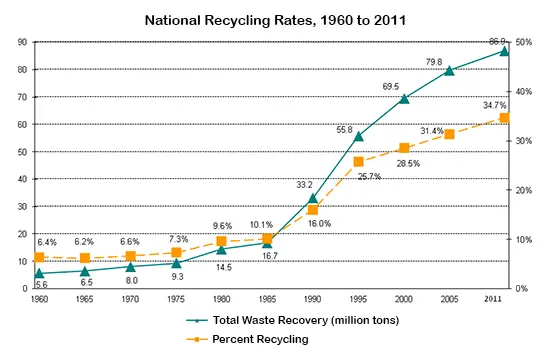
The graph below shows waste recycling rates in the U.S. from 1960 to 2011. Summarise the information by selecting and reporting the main features, and make comparisons where relevant.

Write at least 150 words.

Waste recycling rates in the U.S. from 1960 to 2011

Read the following sample answer. Complete the answer by filling the gaps with the correct form of the words in the box. Some words can be used more than once.

sharp triple peak reach steady

from rise compare significant

The graph depicts waste recycling rates in the U.S.  1960 to 2011, in both percentage and tons.

Between 1960 and 1970, the percentage of garbage being recycled annually remained relatively  at just over 6%. It then  slightly over the next 15 years to 10.1% in 1985.

On the other hand, the amount of garbage being recycled  during the same period, from 5.6 million tons in 1960 to 16.7 million tons in 1985. Following this  increase, the amount of waste material being recycled has risen  between 1985 and 2011 when it  at 86.9 million tons.

Similarly, the recycling rate continued to grow  from 1985 to 1995, and then at a slower rate over the next 15 years until it  a peak of 34.7% in 2011. However, this figure is still disappointing  to the total amount of waste being recycled each year.

(150 words)

Previous Post

The percentage of the population living in urban areas

Next Post

The number of children ever born to women aged 40-44 years in Australia for each year the information was collected since 1981

Leave a Reply

Your email address will not be published. Required fields are marked *

POPULAR POSTS

Describe a part of your city that is changing

Nowadays traffic is a serious problem in big cities

Tourists should accept social and environmental responsibility

People in the past used to be more dependent on one another

Units of electricity production by fuel source in Australia and France

The results of a 20-year study into why adults in the UK attend arts events

Many office authorities impose restriction on smoking within the offices premises

IELTS Reading Practice Test 52

Traditional examination are not often true to student’s ability

Describe an important conversation you had in the past

About Us

9IELTS

9IELTS is dedicated to providing free materials and resources for IELTS conquerors. Stay constantly updated with a wide range of ultimate tips, strategies, and practice tests to crack the high-stakes IELTS exam!

Recent Posts

Describe a crowded place you have visited in your country

It is possible to tell a lot about a person’s culture and character from their choice of clothes

Describe your favourite movie

People should use public transport to support pollution control initiatives

Describe an important export item in your country

Disclaimer

The information on this site is for informational purposes only. IELTS is a registered trademark of the University of Cambridge ESOL, the British Council, and IDP Education Australia. This site and its owner are not affiliated, approved or endorsed by University of Cambridge ESOL, the British Council, or IDP Education Australia.
  • About Us
  • Contact Us
  • Disclaimer
  • Terms & Conditions
  • Privacy Policy

Copyright © 2023 9IELTS. All Rights Reserved.

No Result
View All Result
  • Listening
    • Cambridge IELTS Tests
    • IELTS Practice Tests
    • Recent Actual Tests
  • Reading
    • Cambridge IELTS Tests
    • IELTS Practice Tests
    • Recent Actual Tests
  • Speaking
    • Speaking Part 1
    • Speaking Part 2
    • Speaking Part 3
  • Writing
    • General Training Writing Task 1
    • Academic Writing Task 1
      • Bar Chart
      • Line Graph
      • Pie Chart
      • Table
      • Map
      • Process Diagram
      • Mixed Charts
    • IELTS Writing Task 2
      • Advantages & Disadvantages Essays
      • Agree or Disagree Essays
      • Discuss Both Views Essays
      • Direct Questions Essays
      • Problems/Causes & Solutions Essays
  • Grammar
  • Vocabulary
    • Speaking Vocabulary
    • Writing Vocabulary
    • Collocation for IELTS
  • IELTS Books
  • Blog

Copyright © 2023 9IELTS. All Rights Reserved.

This site uses cookies to offer you a better browsing experience. By continuing to use this website, you agree to our Privacy Policy.