• E-mail: [email protected]
  • Listening
    • Cambridge IELTS Tests
    • IELTS Practice Tests
    • Recent Actual Tests
  • Reading
    • Cambridge IELTS Tests
    • IELTS Practice Tests
    • Recent Actual Tests
  • Speaking
    • Speaking Part 1
    • Speaking Part 2
    • Speaking Part 3
  • Writing
    • General Training Writing Task 1
    • Academic Writing Task 1
      • Bar Chart
      • Line Graph
      • Pie Chart
      • Table
      • Map
      • Process Diagram
      • Mixed Charts
    • IELTS Writing Task 2
      • Advantages & Disadvantages Essays
      • Agree or Disagree Essays
      • Discuss Both Views Essays
      • Direct Questions Essays
      • Problems/Causes & Solutions Essays
  • Grammar
  • Vocabulary
    • Speaking Vocabulary
    • Writing Vocabulary
    • Collocation for IELTS
  • IELTS Books
  • Blog
No Result
View All Result
No Result
View All Result
Home IELTS Writing

Waste recycling rates in the US

9IELTS by 9IELTS
October 14, 2022
in IELTS Writing, Academic Writing Task 1, Line Graph
Reading Time: 2 mins read
7
VIEWS

You should spend about 20 minutes on this task.

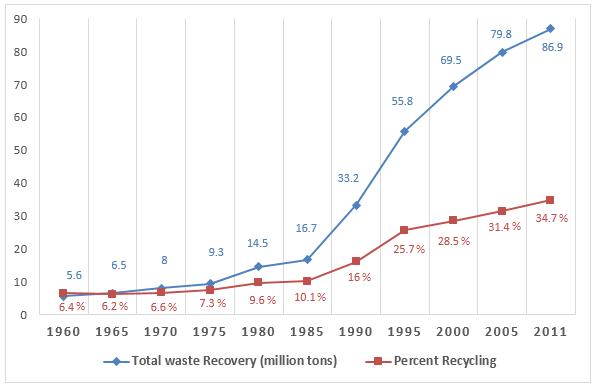
The graph below shows waste recycling rates in the U.S. from 1960 to 2011. Summarise the information by selecting and reporting the main features, and make comparisons where relevant.

You should write at least 150 words.

National Recycling Rates, US, 1960 to 2011

Waste recycling rates in the US

Sample Answer

The line chart outlines how much waste was recycled in the US between 1960 and 2011. The garbage recycling is presented both in quantity, in million tons, and percentage. Generally speaking, waste recycling in the US after 1985 increased remarkably despite a big proportion of litter remained unrecycled.

As the data suggests, 5.6 million tons rubbish was recycled in the USA in 1960 which accounted for 6.4% of the trash production in this year. The recycling in 1965 slightly declined but increased in 1970 when 6.6% waste recycling took place. In 1980, more than 14 million tons of garbage was recycled and it developed by almost 2% after 5 years. After a decade, 16% of total waste was recycled and this ratio after that increased steadily.

Almost one-third of the surplus was recycled in 2005 which amounted nearly 80 million tons. A through observation indicates that a great percentage of scrap in the US is not recycled. For instance, 80 million tons, about 31% waste recycling figure in the US shows that another 160 million tons are not recycled. Finally, in 2011, more than one-third rubbish was recycled which accounted for around 87 million tons of waste produced in the USA.

Previous Post

 Internet users in the Middle East in June 2017

Next Post

Top ten countries spending on travel

Leave a Reply

Your email address will not be published. Required fields are marked *

POPULAR POSTS

Many people nowadays regard shopping as a hobby

Describe a time when you missed a bus/ train/ aeroplane.

Marriages are arranged by the parents but in other cases, people choose their own marriage partner

The monthly expenditure of an average Australian family

The position of women in society has changed markedly in the last twenty years

Master IELTS Visuals for IELTS Writing Task 1 [PDF]

Schools is to turn children into good citizens

Barron’s Writing for the IELTS [PDF]

Describe a street that you like to visit

Schools should spend more money on computers

About Us

9IELTS

9IELTS is dedicated to providing free materials and resources for IELTS conquerors. Stay constantly updated with a wide range of ultimate tips, strategies, and practice tests to crack the high-stakes IELTS exam!

Recent Posts

Games are as important for adults as they are for children

Describe a good photo someone took for you

Grammar and Vocabulary for Advanced with Answers [PDF + Audio]

IELTS Listening Practice Test 34

People over the age of sixty-five can continue to live full and active lives

Disclaimer

The information on this site is for informational purposes only. IELTS is a registered trademark of the University of Cambridge ESOL, the British Council, and IDP Education Australia. This site and its owner are not affiliated, approved or endorsed by University of Cambridge ESOL, the British Council, or IDP Education Australia.
  • About Us
  • Contact Us
  • Disclaimer
  • Terms & Conditions
  • Privacy Policy

Copyright © 2023 9IELTS. All Rights Reserved.

No Result
View All Result
  • Listening
    • Cambridge IELTS Tests
    • IELTS Practice Tests
    • Recent Actual Tests
  • Reading
    • Cambridge IELTS Tests
    • IELTS Practice Tests
    • Recent Actual Tests
  • Speaking
    • Speaking Part 1
    • Speaking Part 2
    • Speaking Part 3
  • Writing
    • General Training Writing Task 1
    • Academic Writing Task 1
      • Bar Chart
      • Line Graph
      • Pie Chart
      • Table
      • Map
      • Process Diagram
      • Mixed Charts
    • IELTS Writing Task 2
      • Advantages & Disadvantages Essays
      • Agree or Disagree Essays
      • Discuss Both Views Essays
      • Direct Questions Essays
      • Problems/Causes & Solutions Essays
  • Grammar
  • Vocabulary
    • Speaking Vocabulary
    • Writing Vocabulary
    • Collocation for IELTS
  • IELTS Books
  • Blog

Copyright © 2023 9IELTS. All Rights Reserved.

This site uses cookies to offer you a better browsing experience. By continuing to use this website, you agree to our Privacy Policy.