» You should spend about 20 minutes on this task.
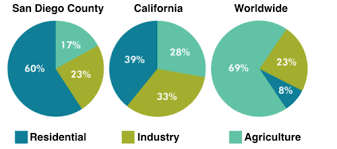
The pie charts below compare water usage in San Diego, California and the rest of the world. Summarise the information by selecting and reporting the main features and make comparisons where relevant.
» Write at least 150 words.

Sample Answer
The pie charts show a comparison of water consumptions in domestic, industrial and agricultural sectors in San Diego, California with the rest of the world. Overall, global agricultural water consumption is far higher than that of industrial and household usages but in San Diego and California residential usages of water are noticeably higher.
Getting back to the details, the global residential water consumption is only 8% which is remarkably lower than that of domestic water usages in Sand Diego and California. Residential water usages in San Diego is 60% which is around 20% higher than that of California. Furthermore, just below one-fourth of water is used for industrial need worldwide which is exactly the same ratio of San Diego’s industrial water use. On the contrary, California’s industrial water requirement is 33%, 10 percent higher than the global needs. Finally, global water consumption for farming is approximately 70% which is significantly higher than the use of water in San Diego and Califonia for the same purpose. Only 17% and 28% water is used for the cultivation purpose in San Diego and Califonia respectively.
