» You are advised to spend about 20 minutes on this task.
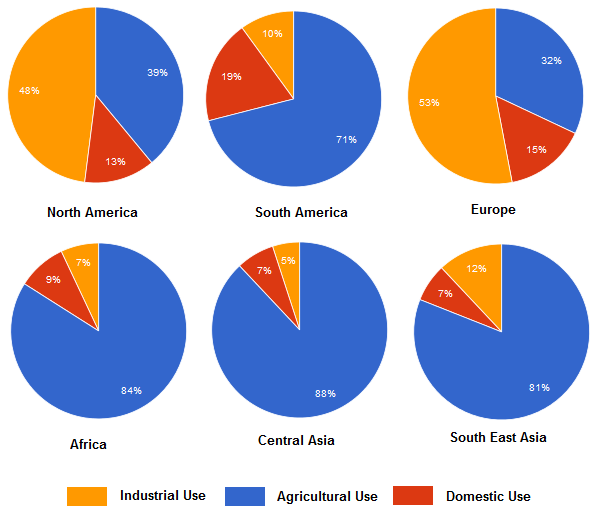
The charts below show the percentage of water used for different purposes in six areas of the world. Summarise the information by selecting and reporting the main features, and make comparisons where relevant.
» You should write at least 150 words.
Percentage of water used for different purposes in six areas of the world.

Sample Answer 1
The provided pie charts compare the domestic, agricultural and industrial water consumptions in six major parts of the world. In general, the highest percentage of water is utilised for agricultural purposes in Asian, African and South American countries while about half of the water in Europe and North America goes to industrial sectors.
As can be seen from the given pie charts, North America’s water consumption has a striking similarity to that of Europe. In both of these continents, about half of the water is required in industrial sectors, almost one-third for crop cultivation and 13-15% for people’s household use. Interestingly, South American’s water-absorbing habit is quite contrary to the North American region and it is more like the water consumptions in Asian and African continents. A great portion of water goes to agricultural division in Asian, African and North American countries which is over eight-tenths of their total consumption. The highest water consumption is cultivation could be observed in Central Asia (88%) which is almost treble than that of Europe. Household water use in South America is higher than other parts of the world and that stands at 19%. Only 7 to 9 percent water is used by people in Asian and African countries for their personal use at home. Finally, the industrial water consumptions in Asian and African areas ranges from 5% to 12% and this ration is quite lower than that of Europe and North America. Interestingly, South East Asia uses more water for manufacturing than each of Africa, central Asia and South America.
[Written by – Sandra Jordan]
Sample Answer 2
The provided illustration compares water consumption for three main purposes in six different areas namely: North America, South America, Europe, Africa, Central Asia and South East Asia. Overall, it is clear from the charts that Asian and African countries used more water for irrigation while North American and European countries used more water for their industrial needs.
To begin with, a major portion of water consumption could be observed in the agricultural sector and this was higher in African and Asian regions than that of American and European parts. More than 80% of water in Africa and Asia went into agricultural fields while this percentage was only 32% in Europe and 39% in North America. North America and Europe required more water in their industrial sectors than that of Asian and African countries. While half of the water was used in the industrial sector in North America and Europe, the percentage of that in African and Asian regions ranged from 5% to 12%. Interestingly, water consumption in North and South America shows a contrasting scenario. Finally, more percentages of household water consumption could be observed in American and European continents than that of Asian and African regions.
[Written by – Piero]
Sample Answer 3
The provided figures give information on the percentage of industrial, agricultural and domestic use of water in the six different regions of the world. Generally, as can be seen from the illustration, the highest percentage of water is used for agricultural demands, while the least percentage of water is used for the domestic needs.
In Africa, South America, Central and South-East Asia more than 70 percent of water goes to the agricultural sector, whereas in North America and Europe this index is 39 % and 32% respectively. On the contrary, these regions consume more water for industrial purposes (48% and 53%), while industrial purposes require only about 10 % average in South America, Africa, Central and South-East Asia. The biggest percent of domestic water use could be observed is in South America (19%) and Asian regions use the minimum water for domestic needs. The maximum usage of water for agricultural aims is in Central Asia (89 %), and only 32% of water is used by the European farming sector.
[Written by – Erlan]
