• E-mail: [email protected]
  • Listening
    • Cambridge IELTS Tests
    • IELTS Practice Tests
    • Recent Actual Tests
  • Reading
    • Cambridge IELTS Tests
    • IELTS Practice Tests
    • Recent Actual Tests
  • Speaking
    • Speaking Part 1
    • Speaking Part 2
    • Speaking Part 3
  • Writing
    • General Training Writing Task 1
    • Academic Writing Task 1
      • Bar Chart
      • Line Graph
      • Pie Chart
      • Table
      • Map
      • Process Diagram
      • Mixed Charts
    • IELTS Writing Task 2
      • Advantages & Disadvantages Essays
      • Agree or Disagree Essays
      • Discuss Both Views Essays
      • Direct Questions Essays
      • Problems/Causes & Solutions Essays
  • Grammar
  • Vocabulary
    • Speaking Vocabulary
    • Writing Vocabulary
    • Collocation for IELTS
  • IELTS Books
  • Blog
No Result
View All Result
No Result
View All Result
Home IELTS Writing

Workforce profile at the top management jobs in South Africa

9IELTS by 9IELTS
October 14, 2022
in IELTS Writing, Academic Writing Task 1, Mixed Charts
Reading Time: 3 mins read
8
VIEWS

» You should spend about 20 minutes on this task.

The charts below show the workforce profile at the top management jobs by ethnicity and race in South Africa based on a 2015/16 report. Write a report for a university teacher describing the information shown in the diagrams below.

Write at least 150 words.

Workforce profile at Top Management level by race in SA
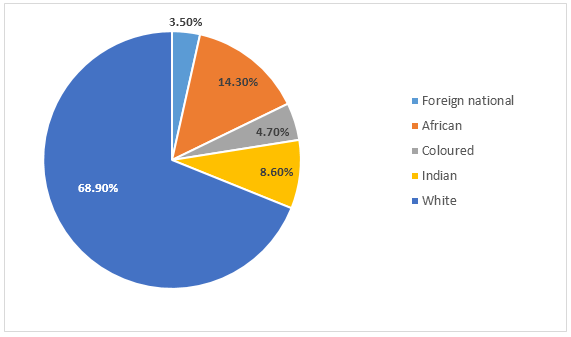
Workforce profile at the top management jobs in South Africa.1

Workforce profile at Top Management level for public and private sector by race in SA
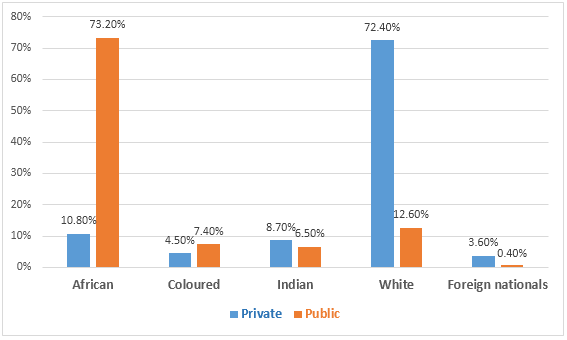
Workforce profile at the top management jobs in South Africa.2

Sample Answer 1

The pie chart compares the South African top management workforce scenario based on different races and ethnicities while the bar graph depicts the same ratio in the public and private sectors. The data is taken from a report published in 2015/16. It is evident that top management positions in South Africa are white dominant and whites are over-presented in private job sectors while the Africans occupy the majority of top positions in public sector jobs.

The pie chart reveals that whites are noticeably over-presented in the higher job positions in South Africa as they accounted for over 68% of all top management jobs compared to only 4.7% and 14.3% Coloured and Africans in such positions. Indians represent just over 8.5% of this workforce while foreigners work in 3.5% of such top-level positions.

The bar graph depicts that South African top public sector jobs, over 73%, are dominated by African workers while white over-presents the private sector jobs. Every three out of five top private-sector jobs are occupied by whites. Finally, Indians accounted for 8 and 6 percentage private and public job positions, higher than the ratio of Coloured and foreigners’ job ratio in top management in South Africa.

Sample Answer 2

The pie chart displays the proportions of top job positions held by people, categorized into five different races, while the bar chart shows the comparison based on races along with public and private sectors. Both charts are based on a report about South Africa in 2015/16.

Overall, white people were dominant in top management level and also held the majority of private sector jobs. On the other hand, public sector had the presence of Africans more than any other nation.

To begin with, about 2 out of every 3 top positions belonged to white people in South Africa during 2015 and 2016. At the same time, Africans accounted for 14.3 percent of those jobs. On the other hand, the remaining three races had their figures of less than 10%.  In detail, Indian people represented 8.6%, almost doubled the percentage of coloured people (4.7%), while foreigners only held 3.5 percent of all top level positions.

Regarding the bar chart, Africans took over more than 73% of public job positions and an almost equal figure can be seen for white people in private jobs. Indians hold 8.7 and 6.5 percent of private and public sector job positions, respectively. On the other hand, coloured people and foreigners were around 4% in private sector while the percentage of foreigners holding top postions in public sector jobs was negligible (only 0.4%).

[Written by – Nguyen Thuong Vu]

Previous Post

Changes in sales of four different types of books

Next Post

Scotland’s exports to the rest of the UK and the rest of the world

Leave a Reply

Your email address will not be published. Required fields are marked *

POPULAR POSTS

IELTS Reading Practice Test 151

The role of prisons should be to punish criminals who have committed serious crimes

Describe a recent sports event that you have participated in or watched

Basic IELTS Series: Listening, Reading, Writing, Speaking [PDF + Audio]

Describe a famous celebrity you admire

You were hurt in a minor accident inside a supermarket

Very few school children learn about the value of money

IELTS Listening Practice Test 94

IELTS Reading Recent Actual Test 29

You recently visited a tourist attraction and you were very pleased

About Us

9IELTS

9IELTS is dedicated to providing free materials and resources for IELTS conquerors. Stay constantly updated with a wide range of ultimate tips, strategies, and practice tests to crack the high-stakes IELTS exam!

Recent Posts

Many of the problems young people now experience arise from the fact that many married women now work

Describe a life changing experience

Describe a change you would like in your life

IELTS Writing Vocabulary: Environment

501 Grammar and Writing Questions (501 Series) 3rd Edition

Disclaimer

The information on this site is for informational purposes only. IELTS is a registered trademark of the University of Cambridge ESOL, the British Council, and IDP Education Australia. This site and its owner are not affiliated, approved or endorsed by University of Cambridge ESOL, the British Council, or IDP Education Australia.
  • About Us
  • Contact Us
  • Disclaimer
  • Terms & Conditions
  • Privacy Policy

Copyright © 2023 9IELTS. All Rights Reserved.

No Result
View All Result
  • Listening
    • Cambridge IELTS Tests
    • IELTS Practice Tests
    • Recent Actual Tests
  • Reading
    • Cambridge IELTS Tests
    • IELTS Practice Tests
    • Recent Actual Tests
  • Speaking
    • Speaking Part 1
    • Speaking Part 2
    • Speaking Part 3
  • Writing
    • General Training Writing Task 1
    • Academic Writing Task 1
      • Bar Chart
      • Line Graph
      • Pie Chart
      • Table
      • Map
      • Process Diagram
      • Mixed Charts
    • IELTS Writing Task 2
      • Advantages & Disadvantages Essays
      • Agree or Disagree Essays
      • Discuss Both Views Essays
      • Direct Questions Essays
      • Problems/Causes & Solutions Essays
  • Grammar
  • Vocabulary
    • Speaking Vocabulary
    • Writing Vocabulary
    • Collocation for IELTS
  • IELTS Books
  • Blog

Copyright © 2023 9IELTS. All Rights Reserved.

This site uses cookies to offer you a better browsing experience. By continuing to use this website, you agree to our Privacy Policy.