» You should spend about 20 minutes on this task.
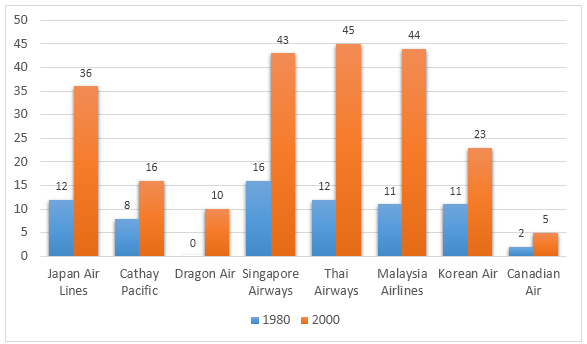
The graph below presents the number of different airline flights coming to Hong Kong per week in 1980 and 2000. Write a report for a university lecturer describing the information shown in the diagrams below.
Write at least 150 words.
Number of flights coming to Hong Kong per week

Sample Answer 1
The bar chart shows the number of incoming flights from eight airlines to Hong Kong per week in 1980 and 2000.
Overall, in 2000, Hong Kong received significantly more flights from these airlines compared to 1980. Besides, in 1980, the majority of the flights came from Singapore, whereas in 2000, Singapore, Malaysia and Thai, all three airlines were the major contributors.
According to the data, in 1980, 16 flights arrived from Singapore per week. Japan Airlines and Thai airways landed 12 flights. Flights from Malaysian Airlines and Korean Air were marginally lower than Thai, as these airlines sent 11 different flights to Hong Kong. 8 Cathey Pacific flights landed in Hong Kong airport and the least number of flights came from Canada, weekly 2 flights only. Interestingly, Dragon Air had no presence in 1980.
On the other hand, in 2000, Singapore, Malaysia and Thai sent the highest number of flights to Hong Kong, around 44 flights weekly. The flight coming from Japan was three times more than what it was in 1980. Besides, the number of incoming Cathey Pacific and Korean Air flights almost doubled. Moreover, weekly 5 flights landed in Hong Kong which departed from Canda. Finally, Hong Kong received 10 flights from Dragon Air.
[Written by – Debarati Banerjee]
Sample Answer 2
The bar graph shows the number of incoming flights from different airlines to Hong Kong in a week both in 1980 and 2000.
Overall, weekly incoming flights to Hong Kong increased significantly in 20 years and the majority of these flights came from Thailand, Singapore and Malaysia.
According to the illustration, the highest airlifts in a week in Hong Kong was from Singapore Airways, accounting 16 different flights in 1980. Japanese and Thai Airlines landed 12 flights each to Hong Kong. Different air flights from Malaysia and Korea were marginally lower than that of Thai Airways. Cathay Pacific had 8 flights in a week and the lease number of air voyages to Hong Kong came from Canadian Air – only 2/week.
After two decades, the weekly flight number from these airways considerably went up and the highest flights (45) came from Thai Airways, roughly 4 times higher than that of two decades ago. A similar number of flights came from Malaysian and Singaporean airlines and these flights noticeably rose compared to 1980’s flight number. Interestingly, 10 flights per week came from Dragon airways in 2000 and this airline did not have any flight to Hong Kong in 1980. Flights from Japanese and Korean airways trebled and doubled respectively per week while 5 from Canadian Airs reached Hong Kong per week.
Sample Answer 3
The graph compares the number of flights from different airlines that reached to Hong Kong per week in 1980 and 2000. Generally speaking, the number of flights in 2000 remarkably increased and the highest number of flights to Hong Kong came from Thailand, Malaysia and Singapore.
As is given, Japan Airlines had 12 flights to Hong Kong in a week in 1980 and it trebled in just 20 years. During this time, Cathay Pacific’s flight doubled from its initial 8 weekly flights. Dragon Air had no operation in Hong Kong in 1980 but in 2000, it had 10 weekly flights to Hong Kong. Thai, Malaysian and Singaporean Airlines flew a significant number of flights to Hong Kong in 2000 and their number of weekly flights were 45, 44 and 43 respective. These numbers were 3 to 4 times higher than that of 2 decades ago. While flights from Korean Air roughly doubled from 11 to 23 flights in a week, Canadian Airs flew 5 flights per week in 2000 compared to only 2 in 1980.
