» You should spend about 20 minutes on this task.
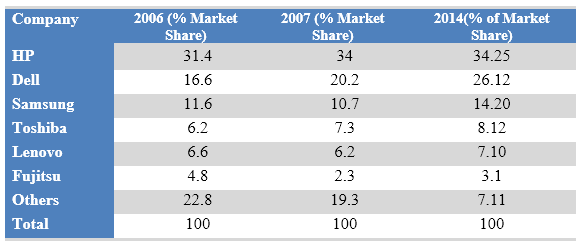
The table below shows the worldwide market share of the notebook computer market for manufacturers in the years 2006, 2007 and 2014. Summarise the information by selecting and reporting the main features and make comparisons where relevant.
Write at least 150 words.

Sample Answer
The table compares the percentages of market share by different laptop brands in three different years – 2006, 2007 and 2014. A glance at the graph reveals that HP was the leading notebook manufacturer in these years.
As can be seen in the table, HP had the largest market share of laptops in 2006 and it retained the top position in 2007 and 2014 as well with around one-third of the total market. Dell secured the second position with 16.6% market share in 2006 and enjoyed a 10% increase in 2014. Samsung had only 11.6% share of laptop market in 2006 but this brand managed to capture over 14% global market share in 8 years. All the top three brands of laptop manufacturing had been able to increase their market share except Samsung in 2007. Toshiba and Lenovo had around 6 percent notebook market share in 2006 and in 8 years their market share increased slightly. The lowest market share was possessed by Fujitsu in 2006 and after 8 years its market share slightly declined and reached to 3.1%. All other brands captured a significant market share in 2006 (22.8%) but only 7.11% in 2014.
