You should spend about 20 minutes on this task.
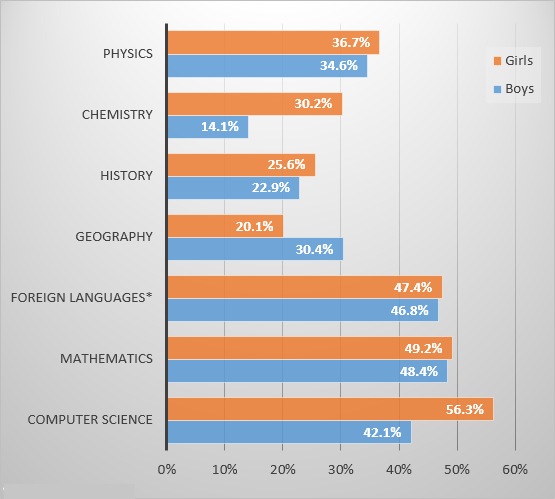
The bar chart below shows the percentage of students who passed their high school competency exams, by subject and gender, during the period 2010-2011. Summarise the information by selecting and reporting the main features, and make comparisons where relevant.
Write at least 150 words.

Look at the graph and complete the following model answer by writing NO MORE THAN THREE WORDS in each space.
Sample Answer
The graph shows the percentages of boys and girls who were successful in their high school competency exams in the period from 2010 to 2011, by subject.
Overall, students of both sexes best in Computer Science, Mathematics, and Foreign Languages, French, German and Spanish. Results for boys and girls were roughly in Computer Science and Mathematics. In other subjects, , there were some significant .
Girls achieved by far their in Computer Science, with a pass rate of , which was than the boys. The difference was even in Chemistry, where more girls passed. subject where boys’ results were better than girls was where they achieved a pass rate of , which was 10% higher than for girls.
In general, that during the period in question girls performed better in most subjects in the competency exams than boys.
