• E-mail: admin@9ielts.com
  • Listening
    • IELTS Practice Tests
    • Recent Actual Tests
  • Reading
    • IELTS Practice Tests
    • Recent Actual Tests
  • Speaking
    • Speaking Part 1
    • Speaking Part 2
    • Speaking Part 3
  • Writing
    • General Training Writing Task 1
    • Academic Writing Task 1
      • Bar Chart
      • Line Graph
      • Pie Chart
      • Table
      • Map
      • Process Diagram
      • Mixed Charts
    • IELTS Writing Task 2
      • Advantages & Disadvantages Essays
      • Agree or Disagree Essays
      • Discuss Both Views Essays
      • Direct Questions Essays
      • Problems/Causes & Solutions Essays
  • Grammar
  • Vocabulary
    • Speaking Vocabulary
    • Writing Vocabulary
    • Collocations for IELTS
  • Books
  • Blog
No Result
View All Result
No Result
View All Result
Home IELTS Writing Academic Writing Task 1

Alcohol-related deaths in 7 countries and average beer consumption

9IELTS by 9IELTS
July 18, 2022
in Academic Writing Task 1
Reading Time: 3 mins read
10
VIEWS

» You should spend about 20 minutes on this task.

The graph below shows the alcohol-related deaths in 7 different countries and the average beer consumption in 2005.

Summarise the information by selecting and reporting the description of the correlation of the table that follows.

» Write at least 150 words.

Alcohol-related deaths in 7 countries and average beer consumption.1

Sample Answer 1:


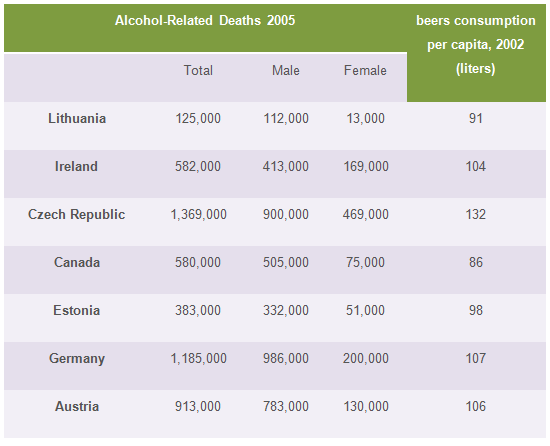
The table data shows the alcohol-related mortality in 2005 in 7 different countries and per person beer consumption in these countries in 2002. Overall, the most alcohol-related deaths were in the Czech Republic in 2005 while the average beer consumption there was also the highest. Death from alcohol intake was more prevalent among men than that of women.

More than 5 million people departed in 2005 from the alcohol intake in the given seven countries and it was significantly higher among men. There is a connection between the per capita beer consumption with the death from alcohol-related problems.

In the Czech Republic, on an average, each citizen drank 132 litres beer in 2005 and that caused the highest number of alcohol-related death in this country (about 1,36,9000 death). German consumed the second highest amount of beer and it caused the second highest death in this country which was about 1,185,000. Lithuanian population drank comparatively fewer litres of beers on an average and the least number of people (about 125,000) died from the alcohol-related diseases there. Austria, Ireland, Canada and  Estonia had comparatively higher alcohol consumption and higher death rates from alcohol.

Interestingly the alcohol-related death in Canada was higher than the Estonia and Lithuania though Canadian people consumes comparatively less quantity of beers than the latter two countries. Finally, the percentage of females who died from alcohol-related problems was lower than their male counterparts.

Sample Answer 2:


The provided table data outlines per capita beer consumption and deaths from alcohol intake in seven different countries. Overall, the higher the alcohol consumption was in a country, the higher the mortality rate was there and death cases among men were more prevalent than that of females.

In details, average beer consumption in the Czech Republic was the highest in 2002, 132 litres per person, and the alcohol-related death count was also the maximum in this country in 2005. Around 1.37 million Czechs died from alcohol-related complexities in 2005 and 0.9 million of them were men. Per capita beer consumption in Germany, Austria and Ireland were almost similar, 107, 106 and 104 litres respectively and death tolls from alcohol intake in these countries were also higher. Around 1.1, 0.91 and 0.58 million people from these countries departed due to their alcohol issues and the number of deceased males was significantly higher than that of females. The lowest beer intake could be observed in Canada, 86 litres per person in a year, but the number of Canadians died from alcohol-related problem was higher than that of Estonia and Lithuania. 125 thousand Lithuanians died of alcohol-caused problems of which only 13000 were females.

Previous Post

Process by which bricks are manufactured for the building industry

Next Post

Number of houses built per year in two cities Derby and Nottingham

Leave a Reply Cancel reply

Your email address will not be published. Required fields are marked *

POPULAR POSTS

Cambridge IELTS 1-19 Book Series [PDF + Audio]

Cambridge IELTS 20 Academic [Update 2025]

Cambridge IELTS 19 Academic [PDF + Audio]

200 IELTS Speaking Sample Answers [PDF + Audio]

Cambridge IELTS 18 Academic [PDF + Audio]

IELTS Recent Actual Tests [Full PDF + Audio]

IELTS Listening Practice Test 204

Cambridge IELTS 18 General Training [PDF + Audio]

IELTS Reading Practice Test 320

Cambridge IELTS 17 General Training [PDF + Audio]

About Us

9ielts logo

9IELTS is dedicated to providing free materials and resources for IELTS conquerors. Stay constantly updated with a wide range of ultimate tips, strategies, and practice tests to crack the high-stakes IELTS exam!

Recent Posts

Shops should not be allowed to sell any food or drink scientifically proven bad

Describe your favourite outdoor activity

Social networking sites have a huge negative impact

Describe a time when you saw something interesting on social media

Places around the world seem similar nowadays

Disclaimer

The information on this site is for informational purposes only. IELTS is a registered trademark of the University of Cambridge ESOL, the British Council, and IDP Education Australia. This site and its owners are not affiliated, approved or endorsed by University of Cambridge ESOL, the British Council, or IDP Education Australia.
  • About Us
  • Contact Us
  • Disclaimer
  • Terms & Conditions
  • Privacy Policy

© 2024 9IELTS. All Rights Reserved.

No Result
View All Result
  • Listening
    • IELTS Practice Tests
    • Recent Actual Tests
  • Reading
    • IELTS Practice Tests
    • Recent Actual Tests
  • Speaking
    • Speaking Part 1
    • Speaking Part 2
    • Speaking Part 3
  • Writing
    • General Training Writing Task 1
    • Academic Writing Task 1
      • Bar Chart
      • Line Graph
      • Pie Chart
      • Table
      • Map
      • Process Diagram
      • Mixed Charts
    • IELTS Writing Task 2
      • Advantages & Disadvantages Essays
      • Agree or Disagree Essays
      • Discuss Both Views Essays
      • Direct Questions Essays
      • Problems/Causes & Solutions Essays
  • Grammar
  • Vocabulary
    • Speaking Vocabulary
    • Writing Vocabulary
    • Collocations for IELTS
  • Books
  • Blog

© 2024 9IELTS. All Rights Reserved.