» You should spend about 20 minutes on this task.
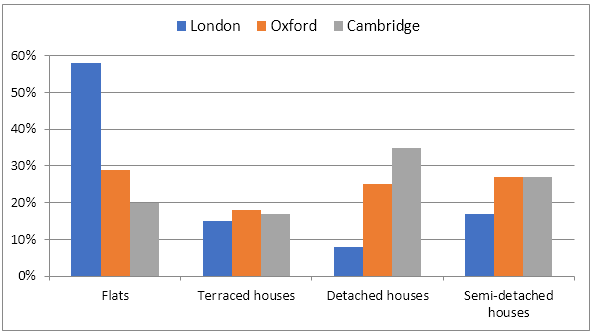
The following chart illustrates the results of a British survey taken in 2005 related to Housing preferences of UK people. Write a report summarising the data shown.
» You should write at least 150 words.
Housing preferences in the UK (2005)

Sample Answer
The given bar graph shows data on the housing preferences of UK citizens and this data was taken as part of a survey made on 2005. As is observed from the data, most of the London dwellers preferred flats while detached & semi-detached houses were more popular among the people of Oxford and Cambridge.
As is presented in the bar graph, about 58% citizen of London preferred flats while less than 30% people of Oxford and Cambridge preferred flats as their housing. Interestingly people from all those three cities preferred terrace houses in a similar percentage which is around 15-18 %. Least preferred housing type for London people was detached houses which were preferred by less than 10% of London citizens while this housing type was preferred by about 25% Oxford people and 35% Cambridge people. Finally, semi-detached houses were more preferred by Oxford and Cambridge people (about 27%) and only 17% people from London preferred this sort of housing.
To summarise, the survey result summarises that flat was the most preferred housing solution for London people while Oxford and Cambridge’s people preferred detached and semi-detached housing.
(Approximately 187 words)
