• E-mail: admin@9ielts.com
  • Listening
    • IELTS Practice Tests
    • Recent Actual Tests
  • Reading
    • IELTS Practice Tests
    • Recent Actual Tests
  • Speaking
    • Speaking Part 1
    • Speaking Part 2
    • Speaking Part 3
  • Writing
    • General Training Writing Task 1
    • Academic Writing Task 1
      • Bar Chart
      • Line Graph
      • Pie Chart
      • Table
      • Map
      • Process Diagram
      • Mixed Charts
    • IELTS Writing Task 2
      • Advantages & Disadvantages Essays
      • Agree or Disagree Essays
      • Discuss Both Views Essays
      • Direct Questions Essays
      • Problems/Causes & Solutions Essays
  • Grammar
  • Vocabulary
    • Speaking Vocabulary
    • Writing Vocabulary
    • Collocations for IELTS
  • Books
  • Blog
No Result
View All Result
No Result
View All Result
Home IELTS Writing

Cases of diseases caused by X virus in Australia

9IELTS by 9IELTS
July 16, 2022
in IELTS Writing, Academic Writing Task 1, Line Graph
Reading Time: 2 mins read
5
VIEWS

» You should spend about 20 minutes on this task.

The line graph below shows the cases of diseases caused by X virus in Australia from 1960 to 1995. Summarise the information by selecting and reporting the main features, and make comparisons where relevant.

» You should write at least 150 words.
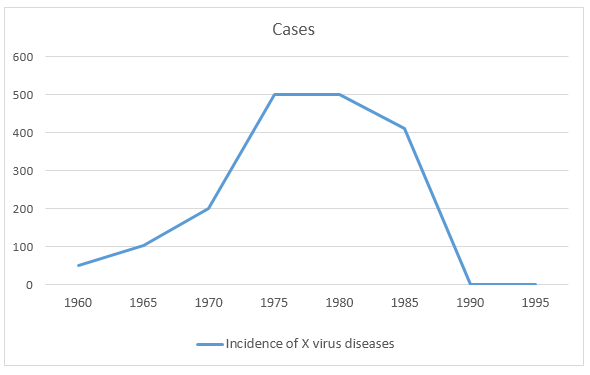
Cases of diseases caused by X virus in Australia

Sample Answer 1

The line graph gives data on the X virus diseases reported from 1960 to 1995 in Australia. The horizontal line presents years while the vertical line shows the number of reported cases.

Overall, the highest number of X virus-related incidents occurred from 1975 to 1080 in Australia and after 1990, this virus could not cause any more illness in Australia.   

As can be seen in the illustration, the number of affected people from the X virus stood at only 50 in 1960 and in the next 10 years, it gradually increased. Two hundred people were infected in 1970 and afterwards, the fatality sharply increased and reached a peak, at 500 cases in 1975. This number remained stable over the next 5 years and then decreased by 100 in 1985. However, the recorded illness due to this virus in the next 5 years slumped, and in 1990, not a single case of X virus-related disease was found in Australia. During the last five years, from 1990 to 1995, no one was reported to become sick from the attack of this virus in Australia.


Sample Answer 2

The line graph shows the changes in the number of X virus cases in Australia, throughout 35 years, starting from 1960. Overall, most cases took place between 1975 and 1980 and after 1990, no cases from this virus was reported in Australia.

To begin with, in 1960, around 50 cases from the X virus was reported in Australia. As the years went by, the figure increased, which had been exactly 100 in 1965. The most significant increase came as the disease skyrocketed and reached a peak, at 500 cases in 1975.

The number of cases remained at the peak, 500 cases, for 5 years before decreasing by almost 100 in 1985. And finally, from 1990, it can be seen that the X virus no longer created any illnesses for Australian people. The most significant change in the number of cases came between the years 1970-1975 and 1985-1990. On the other hand, the X virus had the largest impact on Australia between 1975 and 1985.

[Written by – Nguyen Thuong Vu]

Previous Post

Journey by different means in 4 countries

Next Post

Researchers in technology per million people in five countries

Leave a Reply Cancel reply

Your email address will not be published. Required fields are marked *

POPULAR POSTS

Cambridge IELTS 1-19 Book Series [PDF + Audio]

Cambridge IELTS 20 Academic [Update 2025]

Cambridge IELTS 19 Academic [PDF + Audio]

200 IELTS Speaking Sample Answers [PDF + Audio]

Cambridge IELTS 18 Academic [PDF + Audio]

IELTS Recent Actual Tests [Full PDF + Audio]

IELTS Listening Practice Test 204

Cambridge IELTS 18 General Training [PDF + Audio]

IELTS Reading Practice Test 320

Cambridge IELTS 17 General Training [PDF + Audio]

About Us

9ielts logo

9IELTS is dedicated to providing free materials and resources for IELTS conquerors. Stay constantly updated with a wide range of ultimate tips, strategies, and practice tests to crack the high-stakes IELTS exam!

Recent Posts

Young people have gained status and power but old people have lost

IELTS Listening Practice Test 133

IELTS Speaking Part 3: Topic 32

The recycling process of aluminium cans

Parents and teachers make many rules for children to encourage good behaviour

Disclaimer

The information on this site is for informational purposes only. IELTS is a registered trademark of the University of Cambridge ESOL, the British Council, and IDP Education Australia. This site and its owners are not affiliated, approved or endorsed by University of Cambridge ESOL, the British Council, or IDP Education Australia.
  • About Us
  • Contact Us
  • Disclaimer
  • Terms & Conditions
  • Privacy Policy

© 2024 9IELTS. All Rights Reserved.

No Result
View All Result
  • Listening
    • IELTS Practice Tests
    • Recent Actual Tests
  • Reading
    • IELTS Practice Tests
    • Recent Actual Tests
  • Speaking
    • Speaking Part 1
    • Speaking Part 2
    • Speaking Part 3
  • Writing
    • General Training Writing Task 1
    • Academic Writing Task 1
      • Bar Chart
      • Line Graph
      • Pie Chart
      • Table
      • Map
      • Process Diagram
      • Mixed Charts
    • IELTS Writing Task 2
      • Advantages & Disadvantages Essays
      • Agree or Disagree Essays
      • Discuss Both Views Essays
      • Direct Questions Essays
      • Problems/Causes & Solutions Essays
  • Grammar
  • Vocabulary
    • Speaking Vocabulary
    • Writing Vocabulary
    • Collocations for IELTS
  • Books
  • Blog

© 2024 9IELTS. All Rights Reserved.