• E-mail: [email protected]
  • Listening
    • Cambridge IELTS Tests
    • IELTS Practice Tests
    • Recent Actual Tests
  • Reading
    • Cambridge IELTS Tests
    • IELTS Practice Tests
    • Recent Actual Tests
  • Speaking
    • Speaking Part 1
    • Speaking Part 2
    • Speaking Part 3
  • Writing
    • General Training Writing Task 1
    • Academic Writing Task 1
      • Bar Chart
      • Line Graph
      • Pie Chart
      • Table
      • Map
      • Process Diagram
      • Mixed Charts
    • IELTS Writing Task 2
      • Advantages & Disadvantages Essays
      • Agree or Disagree Essays
      • Discuss Both Views Essays
      • Direct Questions Essays
      • Problems/Causes & Solutions Essays
  • Grammar
  • Vocabulary
    • Speaking Vocabulary
    • Writing Vocabulary
    • Collocation for IELTS
  • IELTS Books
  • Blog
No Result
View All Result
No Result
View All Result
Home IELTS Writing

Researchers in technology per million people in five countries

9IELTS by 9IELTS
October 17, 2022
in IELTS Writing, Academic Writing Task 1, Table
Reading Time: 2 mins read
8
VIEWS

» You should spend about 20 minutes on this task.

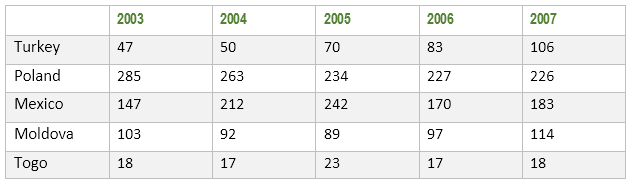
The table gives information about the number of people working as researchers in technology per million people in five countries. Summarise the information by selecting and reporting the main features, and make comparisons where relevant.

» You should write at least 150 words.

Researchers in technology per million people in five countries

Sample Answer

The table data compares the number of tech researchers per million population in five countries in five successive years commencing from 2003. Overall, Poland had a greater number of researchers per million citizens in technology while Togo had the least.

Getting back to the details, Turkey had slightly less than 50 technology-related researchers in 2003 per million of its population which moderately increased each year and reached to over 100 in 2007. Poland had the largest proportion of tech researchers among these countries and 285 Polish were tech researchers per million people in 2003. However, over the time this number declined continuously and after 4 years it stood at 226 per million. Despite the drop, the ratio of researchers in Poland in 2007 was the highest and roughly double than that of Moldova and Tukey. Mexican tech researchers’ ratio in 2003 was 147 per million which increased to 242 two years later and dropped to 113 in 2007. Moldova had 103 of these professionals per million and in 4 years, this proportion reached to 114 with a decrease in the previous three years. The lowest ratio of tech researchers was in Togo where only 18 such professionals existed in 2003 in every million population and remained the same in 2007.

Previous Post

Cases of diseases caused by X virus in Australia

Next Post

Water usage in San Diego California and the rest of the world

Leave a Reply

Your email address will not be published. Required fields are marked *

POPULAR POSTS

Global robotics market 2000 – 2025

IELTS Reading Practice Test 173

Describe someone who is a good teacher

You have arranged a meeting with a business partner

Describe a story or novel you have read that you found to be particularly interesting

IELTS Listening Practice Test 191

Describe Your Favorite Actor

Describe a subject that helped you in life

People remember special gifts or presents that they receive

Describe a person who often travels by plane

About Us

9IELTS

9IELTS is dedicated to providing free materials and resources for IELTS conquerors. Stay constantly updated with a wide range of ultimate tips, strategies, and practice tests to crack the high-stakes IELTS exam!

Recent Posts

IELTS Reading Practice Test 257

Income adults and children spent on 4 common items in UK

IELTS Reading Practice Test 174

4000 Essential English Words [PDF + Audio] Free

IELTS Reading Practice Test 133

Disclaimer

The information on this site is for informational purposes only. IELTS is a registered trademark of the University of Cambridge ESOL, the British Council, and IDP Education Australia. This site and its owner are not affiliated, approved or endorsed by University of Cambridge ESOL, the British Council, or IDP Education Australia.
  • About Us
  • Contact Us
  • Disclaimer
  • Terms & Conditions
  • Privacy Policy

Copyright © 2023 9IELTS. All Rights Reserved.

No Result
View All Result
  • Listening
    • Cambridge IELTS Tests
    • IELTS Practice Tests
    • Recent Actual Tests
  • Reading
    • Cambridge IELTS Tests
    • IELTS Practice Tests
    • Recent Actual Tests
  • Speaking
    • Speaking Part 1
    • Speaking Part 2
    • Speaking Part 3
  • Writing
    • General Training Writing Task 1
    • Academic Writing Task 1
      • Bar Chart
      • Line Graph
      • Pie Chart
      • Table
      • Map
      • Process Diagram
      • Mixed Charts
    • IELTS Writing Task 2
      • Advantages & Disadvantages Essays
      • Agree or Disagree Essays
      • Discuss Both Views Essays
      • Direct Questions Essays
      • Problems/Causes & Solutions Essays
  • Grammar
  • Vocabulary
    • Speaking Vocabulary
    • Writing Vocabulary
    • Collocation for IELTS
  • IELTS Books
  • Blog

Copyright © 2023 9IELTS. All Rights Reserved.

This site uses cookies to offer you a better browsing experience. By continuing to use this website, you agree to our Privacy Policy.