» You should spend about 20 minutes on this task.
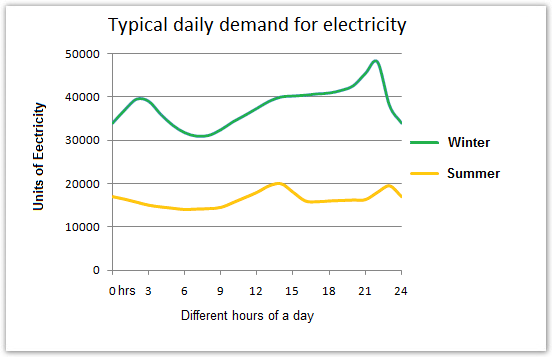
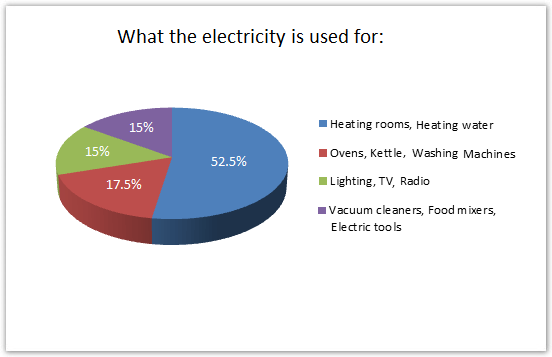
The graph below shows the demand for electricity in England during typical days in winter and summer. The pie chart shows how electricity is used in an average English home.
Summarise the information by selecting and reporting the main features and make comparisons where relevant.
» You should write at least 150 words.
Sample Answer 1
The illustrations show the electricity demand in England in a typical day in winter and summer and also how people use this electricity. According to the first line graph, we can see that the electricity demand in winter is much higher than the demand in summer in England.
In a typical day, the electricity demand in winter season is around 35,000 units and it is around 18,000 units in the summer season. Again the demand for the electricity varies on several hours of the day and the demand from 6:00 to 9:00 am is lesser than the demand in other hours of the day. During the winter the demand is highest from 21:00 to 23:00 and during summer the demand is highest from 13:00 to 14:00 hours.
Based on the pie chart we can infer that the room heating and water heating is the main purpose people consume the electricity in England. The demand for washing machine, kettle and ovens consume around 18% of total electricity consumed and two other categories consume 15% electricity each. These two other categories which consume 30% of total electricity include light, TV, Radio, vacuum cleaner, food mixer and other electric told and devices.
Sample Answer 2
The presented graph illustrates the electricity requisition in England during two different seasons, winter and summer. Meanwhile, the pie chart demonstrates how the electricity is utilised daily and to what quantity.
In general, both in winter and summer, the electricity demand rises up from around 9:00 am to about 23:00 pm and the electricity in mainly spent for heating room and water.
Looking at the detail, the electricity demand in summer is reckoned between 10,000 – 20,000 units. It goes to around 12,000 before 9 am and slightly increases to around 20,000 at 14 pm and relatively fluctuates until the rest of the day. However, in winter, the electricity requisition sets about 35,000 units at 00 am and gradually spikes before it actually rises at 9 am and keeps the level swells until around 45,000 units at 23 pm.
Meanwhile, due to utilisation and quantity, heating room and water require the vast majority, 52%, of electricity using. This high proportion is related to the high electricity demand for these two appliances during winter. Whereas other kitchen and electronic devices, vacuum cleaners, food mixers and electronic tools amass lower proportion, 48%, than heating rooms and water.
[Written by – Linda ]
Sample Answer 3
The given line graph illustrates the demands for electricity during normal days of summer and winter in England, while the pie chart describes how an average household consumes electricity in England.
The line graph exhibits that electricity demand in winter is significantly higher than that in summer. Besides, the pie chart shows that more than half of the electricity is consumed for the purpose of heating rooms and water.
The given illustration shows that in winter, electricity demand in England rise up to almost 48,000 units and drops to nearly 30,000 units. It is generally observed that the demand increases after the evening time. While in summer, the electricity demand rises up to 20,000 units in the noon time and drops to almost 12,000 in the early morning.
The given pie chart demonstrates that more than half of the electricity is utilised for the purpose of heating rooms and water which is 52%. The second major proportion of electricity, 18%, is utilised for using ovens, kettles and washing machines. Lighting, TV and radio utilise 15% electricity while the remaining 15% goes for the vacuum cleaner, food mixers, and electric tools.
[Written by – Zafar]
Sample Answer 4
The line graph compares the electricity demand in England during a regular day in winter and in summer while the pie chart shows the usages of the electricity. Generally speaking, during the winter season, the demand for electricity was much higher than that of the summer in England.
During a typical day during winter, the average electricity requirement was around 35 thousand units while this demand was about 16 thousand units during a summer day. Again the electricity requirement fluctuates during the different hours of a typical day and this demand seems lowest in early morning and highest at late night.
Based on the pie chart data it can be clearly seen that room and water heating require more than half of the total electricity usages. Washing machines, kettle and ovens consume around 18% electricity while lighting houses, watching TV and listening to radio require 15% of the total electricity. Finally, the same percentage, 15% of electricity, is consumed by English people for running vacuum cleaners, food mixers and electric devices.
[Written by – Anidoritrang ]