• E-mail: admin@9ielts.com
  • Listening
    • IELTS Practice Tests
    • Recent Actual Tests
  • Reading
    • IELTS Practice Tests
    • Recent Actual Tests
  • Speaking
    • Speaking Part 1
    • Speaking Part 2
    • Speaking Part 3
  • Writing
    • General Training Writing Task 1
    • Academic Writing Task 1
      • Bar Chart
      • Line Graph
      • Pie Chart
      • Table
      • Map
      • Process Diagram
      • Mixed Charts
    • IELTS Writing Task 2
      • Advantages & Disadvantages Essays
      • Agree or Disagree Essays
      • Discuss Both Views Essays
      • Direct Questions Essays
      • Problems/Causes & Solutions Essays
  • Grammar
  • Vocabulary
    • Speaking Vocabulary
    • Writing Vocabulary
    • Collocations for IELTS
  • Books
  • Blog
No Result
View All Result
No Result
View All Result
Home IELTS Writing

Expenditures for five major categories in 2009

9IELTS by 9IELTS
July 16, 2022
in IELTS Writing, Academic Writing Task 1, Bar Chart
Reading Time: 2 mins read
13
VIEWS

» You should spend about 20 minutes on this task.

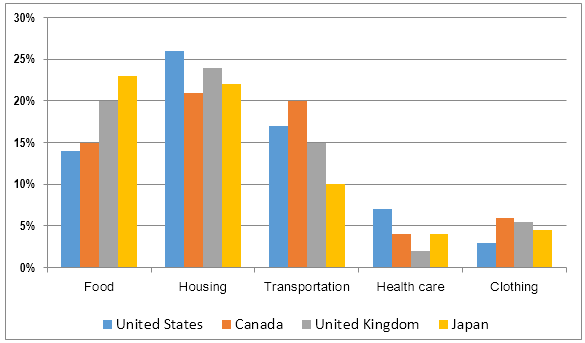
The bar chart below shows shares of expenditures for five major categories in the United States, Canada, the United Kingdom, and Japan in the year 2009. Summarize the information by selecting and reporting the main features, and make comparisons where relevant.

You should write at least 150 words.

Shares of expenditure for selected categories, United States, Canada, United Kingdom, and Japan, 2009

Expenditures for five major categories in 2009

Sample Answer

The bar graph compares how much Americans, Canadians, English and Japanese spent on food, housing, transportation, health care and clothing in 2009. Generally speaking, housing and food cost more to these nationalities than other expenses in this year.

As is given in the column graph, Japanese spent around 23% money on food and this ratio was higher than that of other nationalities. UK residents’ spending on food was one-fifth of their total expenditure while it was less than 15% for the citizens of the USA and Canada. Housing on an average drained the highest percentages of money and it was more expensive in the United States as more than one-fourth of their money went on arranging accommodation. All other nationalities had to spend between 20% – 24% for housing.     

Transportation cost, on the other hand, was highest in Canada and one-fifth of spending by Canadians were for commuting. Japanese people spent the least on commuting and it was 10% or their expenses. Interestingly, these nationalities spent around 5% money on clothing which was slightly higher than that of their medical expenses. Us citizens had to spend the highest on health care which accounted for around 7% of their cost while it was the lowest in the UK.

Previous Post

Vocabulary for IELTS Writing Task 2 Band 8+

Next Post

Passenger activity on the Toronto Metro system

Leave a Reply Cancel reply

Your email address will not be published. Required fields are marked *

POPULAR POSTS

Cambridge IELTS 1-19 Book Series [PDF + Audio]

Cambridge IELTS 20 Academic [Update 2025]

Cambridge IELTS 19 Academic [PDF + Audio]

200 IELTS Speaking Sample Answers [PDF + Audio]

Cambridge IELTS 18 Academic [PDF + Audio]

IELTS Recent Actual Tests [Full PDF + Audio]

IELTS Listening Practice Test 204

Cambridge IELTS 18 General Training [PDF + Audio]

IELTS Reading Practice Test 320

Cambridge IELTS 17 General Training [PDF + Audio]

About Us

9ielts logo

9IELTS is dedicated to providing free materials and resources for IELTS conquerors. Stay constantly updated with a wide range of ultimate tips, strategies, and practice tests to crack the high-stakes IELTS exam!

Recent Posts

Describe someone you know who is very brave

Explain some of the ways in which humans are damaging the environment

Describe a movie or a book about the future

IELTS Reading Practice Test 23

Internet users in Vietnam from 2003 to 2012

Disclaimer

The information on this site is for informational purposes only. IELTS is a registered trademark of the University of Cambridge ESOL, the British Council, and IDP Education Australia. This site and its owners are not affiliated, approved or endorsed by University of Cambridge ESOL, the British Council, or IDP Education Australia.
  • About Us
  • Contact Us
  • Disclaimer
  • Terms & Conditions
  • Privacy Policy

© 2024 9IELTS. All Rights Reserved.

No Result
View All Result
  • Listening
    • IELTS Practice Tests
    • Recent Actual Tests
  • Reading
    • IELTS Practice Tests
    • Recent Actual Tests
  • Speaking
    • Speaking Part 1
    • Speaking Part 2
    • Speaking Part 3
  • Writing
    • General Training Writing Task 1
    • Academic Writing Task 1
      • Bar Chart
      • Line Graph
      • Pie Chart
      • Table
      • Map
      • Process Diagram
      • Mixed Charts
    • IELTS Writing Task 2
      • Advantages & Disadvantages Essays
      • Agree or Disagree Essays
      • Discuss Both Views Essays
      • Direct Questions Essays
      • Problems/Causes & Solutions Essays
  • Grammar
  • Vocabulary
    • Speaking Vocabulary
    • Writing Vocabulary
    • Collocations for IELTS
  • Books
  • Blog

© 2024 9IELTS. All Rights Reserved.