• E-mail: [email protected]
  • Listening
    • Cambridge IELTS Tests
    • IELTS Practice Tests
    • Recent Actual Tests
  • Reading
    • Cambridge IELTS Tests
    • IELTS Practice Tests
    • Recent Actual Tests
  • Speaking
    • Speaking Part 1
    • Speaking Part 2
    • Speaking Part 3
  • Writing
    • General Training Writing Task 1
    • Academic Writing Task 1
      • Bar Chart
      • Line Graph
      • Pie Chart
      • Table
      • Map
      • Process Diagram
      • Mixed Charts
    • IELTS Writing Task 2
      • Advantages & Disadvantages Essays
      • Agree or Disagree Essays
      • Discuss Both Views Essays
      • Direct Questions Essays
      • Problems/Causes & Solutions Essays
  • Grammar
  • Vocabulary
    • Speaking Vocabulary
    • Writing Vocabulary
    • Collocation for IELTS
  • IELTS Books
  • Blog
No Result
View All Result
No Result
View All Result
Home IELTS Writing Academic Writing Task 1

Growth in the population in largest cities

9IELTS by 9IELTS
October 13, 2022
in Academic Writing Task 1, IELTS Writing, Mixed Charts
Reading Time: 3 mins read
16
VIEWS

You should spend about 20 minutes on this task.

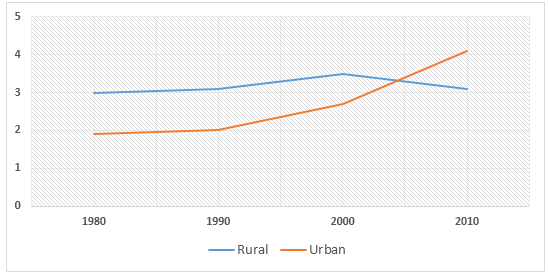
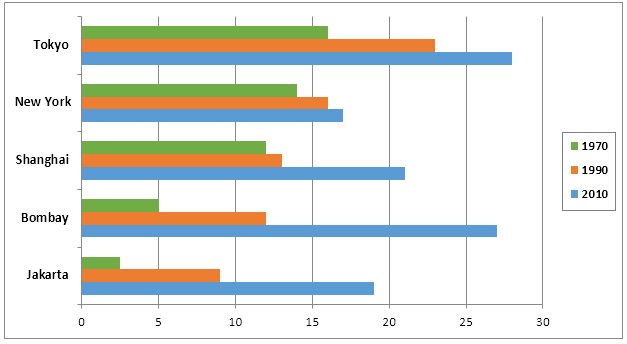
The charts below show the growth in the population in some of the world’s largest cities as well as the population distribution in urban and rural areas.

Population in millions
Top 5 biggest cities by population (millions)

cities-with-highest-population

World population in billions

Summarize the information by selecting and reporting the main features, and make comparisons where relevant.

You should write at least 150 words.  

Sample Answer 1

The bar graph compares the population in five metropolitan areas between 1970 and 2010, while the table outlines the top five cities with the highest population. Finally, the line graph compares urban and rural population distribution from 1980 to 2010.

Generally speaking, the population growth in Bombay and Jakarta was faster than in other cities and Tokyo had the highest number of residents in 2010. Moreover, a higher number of people started living in urban areas than in rural areas after 2005.

According to the bar graph, more than 15 million people lived in Tokyo in 1970, higher than in New York and Shanghai. The population in Bombay was one-third of that of Tokyo and Jakarta had only 2.5 million residents, the least among the five cities. The population in Tokyo increased to 27.6 million in 2010; this was the city with the highest population. However, population growth in Bombay and Jakarta, almost 5.5 times, was higher than any other city listed.

The table data shows that New York was the most populous city in the world in 1950, with precisely 12.5 million people. London and Tokyo stood at the second and third position in this list while Moscow, with its 5.3 million people, was in 5th. In 2010, Tokyo topped the rank, followed by Bombay and Lagos.

Finally, globally 3 billion people lived in rural areas in 1980, while less than 2 billion in cities. In 2010, the number of city-living residents increased to over 4 billion while slightly over 3 in villages.

Sample Answer 2

The bar graph compares the population growth in five large cities between 1970 and 2010, while the table lists the five most populated cities worldwide between 1950 and 2010. In addition, the line graph analyses the global population in rural and urban areas.

Overall, Tokyo had the largest population in 2010, but the population growth in Bombay and Jakarta outranked other cities. Finally, more people started to live in cities after 2005 despite a different scenario in earlier years.

As the data suggests, Tokyo had over 15 million residents in 1970 which was three and five times higher than Bombay and Jakarta, respectively. New York and Shanghai had approximately 14 and 12 million inhabitants this year. After two decades, New York witnessed a meagre population growth while it was dramatic both in Jakarta and Bombay. Population growth in Jakarta and Bombay exceeded all other cities.

In 1950, New York, London, Tokyo, Paris and Moskow were the top five populated cities in the world. In 2010 Bombay, Lagos, Shanghai and Jakarta ranked in the list by eliminating all other cities except Tokyo, which stood first on the chart with over 27 million citizens.

Finally, the global urban population in 1980 was below 2 billion, while 3 billion lived in villages. The population in cities grew steadily and went over  4 billion in 2010, at which point 3 billion global population resided in rural areas.

Previous Post

Unemployment rates for the female in the UK

Next Post

Vocabulary for IELTS Writing Task 2 Band 8+

Leave a Reply

Your email address will not be published. Required fields are marked *

POPULAR POSTS

IELTS Listening Practice Test 25

IELTS Reading Practice Test 221

Is watching television good or bad for children

IELTS Reading Practice Test 114

Describe a time when you visited a friend or family member at their workplace

Describe an occasion that you invited your family or your friends for dinner (eat at home or a restaurant)

Numbers of male and female research students at a US university

The diagram below shows the development of cutting tools in the Stone Age

Men and women in further education in Britain in three periods

Describe an ambition you have not yet achieved

About Us

9IELTS

9IELTS is dedicated to providing free materials and resources for IELTS conquerors. Stay constantly updated with a wide range of ultimate tips, strategies, and practice tests to crack the high-stakes IELTS exam!

Recent Posts

IELTS Reading Practice Test 142

The rate of smoking per 1000 people in Someland

Factors related to academic success in high-school students

You are going to New Zealand for English and Homestay program

Employers nowadays put more emphasis on social skills

Disclaimer

The information on this site is for informational purposes only. IELTS is a registered trademark of the University of Cambridge ESOL, the British Council, and IDP Education Australia. This site and its owner are not affiliated, approved or endorsed by University of Cambridge ESOL, the British Council, or IDP Education Australia.
  • About Us
  • Contact Us
  • Disclaimer
  • Terms & Conditions
  • Privacy Policy

Copyright © 2023 9IELTS. All Rights Reserved.

No Result
View All Result
  • Listening
    • Cambridge IELTS Tests
    • IELTS Practice Tests
    • Recent Actual Tests
  • Reading
    • Cambridge IELTS Tests
    • IELTS Practice Tests
    • Recent Actual Tests
  • Speaking
    • Speaking Part 1
    • Speaking Part 2
    • Speaking Part 3
  • Writing
    • General Training Writing Task 1
    • Academic Writing Task 1
      • Bar Chart
      • Line Graph
      • Pie Chart
      • Table
      • Map
      • Process Diagram
      • Mixed Charts
    • IELTS Writing Task 2
      • Advantages & Disadvantages Essays
      • Agree or Disagree Essays
      • Discuss Both Views Essays
      • Direct Questions Essays
      • Problems/Causes & Solutions Essays
  • Grammar
  • Vocabulary
    • Speaking Vocabulary
    • Writing Vocabulary
    • Collocation for IELTS
  • IELTS Books
  • Blog

Copyright © 2023 9IELTS. All Rights Reserved.

This site uses cookies to offer you a better browsing experience. By continuing to use this website, you agree to our Privacy Policy.