• E-mail: admin@9ielts.com
  • Listening
    • IELTS Practice Tests
    • Recent Actual Tests
  • Reading
    • IELTS Practice Tests
    • Recent Actual Tests
  • Speaking
    • Speaking Part 1
    • Speaking Part 2
    • Speaking Part 3
  • Writing
    • General Training Writing Task 1
    • Academic Writing Task 1
      • Bar Chart
      • Line Graph
      • Pie Chart
      • Table
      • Map
      • Process Diagram
      • Mixed Charts
    • IELTS Writing Task 2
      • Advantages & Disadvantages Essays
      • Agree or Disagree Essays
      • Discuss Both Views Essays
      • Direct Questions Essays
      • Problems/Causes & Solutions Essays
  • Grammar
  • Vocabulary
    • Speaking Vocabulary
    • Writing Vocabulary
    • Collocations for IELTS
  • Books
  • Blog
No Result
View All Result
No Result
View All Result
Home IELTS Writing

Annual Energy Outlook 2008 about consumption of energy in the USA since 1980

9IELTS by 9IELTS
August 1, 2022
in IELTS Writing, Academic Writing Task 1, Line Graph
Reading Time: 2 mins read
22
VIEWS

You should spend about 20 minutes on this task.

The graph below gives information from Annual Energy Outlook 2008 about consumption of energy in the USA since 1980 with projection until 2030. Summarise the information by selecting and reporting the main features, and make comparisons where relevant.

Write at least 150 words.

Information from Annual Energy Outlook 2008 about consumption of energy in the USA since 1980 with projection until 2030

Sample answer

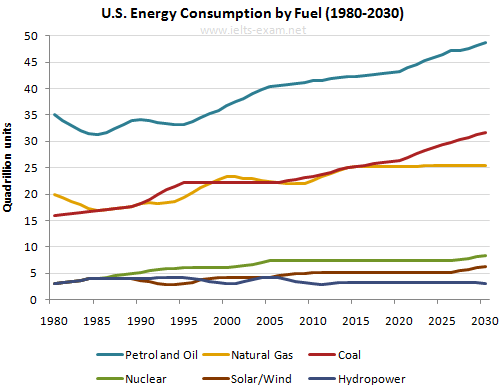
The graph shows energy consumption in the U.S. since 1980 with projections through 2030.

The historical trends show Petrol and Oil as the major fuel sources, rising from 35 quadrillions (35q) units used in 1980 to 42q in 2012. Despite some fluctuation between 1980 and 1995, there was a steady increase, which is expected to continue, reaching 47q in 2030.

Consumption of energy from natural gas and coal followed a similar pattern. From 20q and 15q respectively in 1980, gas showed an initial fall, and coal gradually increased, with the two fuels equal between 1985 and 1990. Consumption has fluctuated since 1990, but both now provide 24q. Coal consumption is projected to rise to 31q in 2030, whereas after 2014, natural gas is forecast to remain stable at 25q.

In 1980, energy from solar/wind, nuclear, and hydropower was the least-used, with only 4q. Nuclear has risen by 3q, and solar/wind by 2. Since 2005, hydropower has fallen back to the 1980 figure. It is expected to remain approximately constant through 2030, while the others are projected to rise gradually after 2025.

Overall, fossil fuels will remain the chief energy source for the US, with a little bit of hydroelectric, nuclear and a smidgen of renewables like wind and solar.

Previous Post

Information about the number of students studying Computer Science at a UK university

Next Post

The total number of minutes (in millions) of telephone calls in Finland

Leave a Reply Cancel reply

Your email address will not be published. Required fields are marked *

POPULAR POSTS

Cambridge IELTS 1-19 Book Series [PDF + Audio]

Cambridge IELTS 20 Academic [Update 2025]

Cambridge IELTS 19 Academic [PDF + Audio]

200 IELTS Speaking Sample Answers [PDF + Audio]

Cambridge IELTS 18 Academic [PDF + Audio]

IELTS Recent Actual Tests [Full PDF + Audio]

IELTS Listening Practice Test 204

IELTS Reading Practice Test 320

Cambridge IELTS 18 General Training [PDF + Audio]

Cambridge IELTS 17 General Training [PDF + Audio]

About Us

9ielts logo

9IELTS is dedicated to providing free materials and resources for IELTS conquerors. Stay constantly updated with a wide range of ultimate tips, strategies, and practice tests to crack the high-stakes IELTS exam!

Recent Posts

Deforestation caused by human activity is happening in many parts of the world

A family member is coming to stay with you

IELTS Listening Practice Test 203

Describe a book based on which a film has been made

Collocation for IELTS: Technology

Disclaimer

The information on this site is for informational purposes only. IELTS is a registered trademark of the University of Cambridge ESOL, the British Council, and IDP Education Australia. This site and its owners are not affiliated, approved or endorsed by University of Cambridge ESOL, the British Council, or IDP Education Australia.
  • About Us
  • Contact Us
  • Disclaimer
  • Terms & Conditions
  • Privacy Policy

© 2024 9IELTS. All Rights Reserved.

No Result
View All Result
  • Listening
    • IELTS Practice Tests
    • Recent Actual Tests
  • Reading
    • IELTS Practice Tests
    • Recent Actual Tests
  • Speaking
    • Speaking Part 1
    • Speaking Part 2
    • Speaking Part 3
  • Writing
    • General Training Writing Task 1
    • Academic Writing Task 1
      • Bar Chart
      • Line Graph
      • Pie Chart
      • Table
      • Map
      • Process Diagram
      • Mixed Charts
    • IELTS Writing Task 2
      • Advantages & Disadvantages Essays
      • Agree or Disagree Essays
      • Discuss Both Views Essays
      • Direct Questions Essays
      • Problems/Causes & Solutions Essays
  • Grammar
  • Vocabulary
    • Speaking Vocabulary
    • Writing Vocabulary
    • Collocations for IELTS
  • Books
  • Blog

© 2024 9IELTS. All Rights Reserved.