You should spend about 20 minutes on this task.
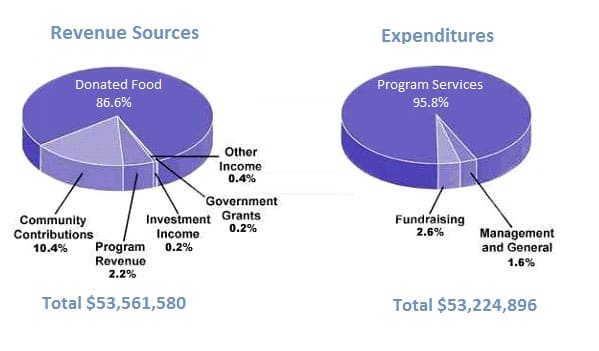
The pie chart shows the amount of money that a children’s charity located in the USA spent and received in one year, 2016.
Summarise the information by selecting and reporting the main features and make comparisons where relevant.
Write at least 150 words.
Sample Answer 1
The pie charts show the revenue sources and expenditures for a year of a children’s charity organization based in the USA. Overall, donated food was the primary source of funds for this charity organization, whereas they spent most of their money on different program services.
According to the illustration, this charity organization earned exactly $53, 561,580 this year and used up $53,224,896. Their saving this year was just over 330,000 dollars.
The highest supply for the charity came as donated food which was more than 86% of the total earnings. One-tenth of their trust was received from community contributions, and the remaining 3% account was managed through program revenue, investment income, government grants and other income.
On the contrary, they exhausted more than 95% of the fund for program services and 2.6% for fundraising. Over 1.5% of their expenditure was made for management and general purposes.
Sample Answer 2
The pie charts illustrate how a USA children’s charity collected and used its money in a year. The first chart is categorized into 6 different revenue sources, and the second one is divided into 3 purposes of expenditures.
Overall, it can be seen that the foundation obtained the most significant portion of its money from donated food. On the other hand, it spent most of its money on the program services.
To begin with, 86.6 per cent of revenue for this children’s charity came from donated food in a year, which is over eight times as much as contributions from the community (10.4%). These two sources accounted for precisely 97 per cent of the total income. Additionally, more than two per cent of income was provided by the program revenue. Finally, the government grants and other income were almost unnoticeable, less than 0.5 per cent.
At the same time, the charity had to spend almost 96% on its program services. Regarding the remaining 4.2 per cent of expenditures, 2.6% was for fundraising, and the rest was for management and general purposes. It is worth noting that the total income was $53,561,580, which was just enough to cover the expenditures of $53,224,896. The charity saved just over 330 thousand dollars at the end of the year.
Sample Answer 3
The pie charts depict income and expenditure in a year by an American charity organization for children. Overall, the children’s charity had exactly six sources of funds; among them, the ultimate source was food donation. In contrast, they spent their money in three sectors, and program services cost them the highest percentage of money.
While the charity essentially spent money on the program service, which was precisely 95.8%, they vastly got their funds as donated food and bought 86.6% of their yearly earnings. The second significant income source was the community contribution, which was one-tenth; however, the second maximum cost was for fundraising, which was 2.6% of the total cost.
Moreover, there were four other sources of revenue for this organization – program revenue (2.2%), investment income (0.2%), government grants (0.2%), and other income(0.4%). On the other hand, management and general cost accounted for 1.6% of the total budget and was the charity’s lowest expenditure. Furthermore, the total receiving fund was $53, 561,580 in a year and the total cost was $53,224,896, which shows just over 330,000 in saving for the charity this year.
Sample Answer 4
The pie charts compare the proportion of money spent and received by a children’s charity in the USA in the year 2016.
Overall, the revenue is greater than the expenditure. The majority of income for the charity is a donation of food, while conducting program services was the highest expenditure.
The large majority of revenue was the donation of food services which accounted for more than four-fifths of the total amount of income. at the same time, organising programs were the highest source of expenditure, almost 96%.
The second-largest revenue resources were community contributions which were one in ten of the total revenue; other than this, program revenue, government grants, investment incomes and other incomes were considered 3% only. However, fundraising, management, and generally were the other charity expenses altogether, devoted only around 4%.
Sample Answer 5
The pie charts show the revenue and expenditures in 2016 for a children’s charity in the USA. Calibration of data is done in percentage.
Overall, the total income was just enough to cover the expenditures. Moreover, donated food made the highest share of total income while the maximum money was spent on program service.
To begin with, donated food provided the most of the revenue for the charity, at 86%. Similarly, concerning expenditures, program services were calculated for nearly all of the outgoings, at 95.8%. The other categories were much smaller. Community contributions were the second largest revenue source, bringing in 10.4% of overall income, and this was followed by program revenue, at 2.2%. on the other hand, investment income, government grants, and other income were minimal sources of revenue, accounting for only 0.8% combined.
There were only two other expenditure items, fundraising and management and general, with a slight difference accounting for 2.6% and 1.6%, respectively.