» You are advised to spend about a maximum of 20 minutes on this task.
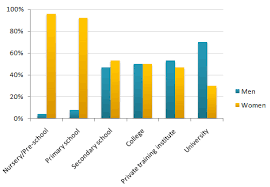
The chart below shows the percentage of male and female teachers in six different types of educational setting in the UK in 2010. Summarise the information by selecting and reporting the main features, and make comparisons where relevant.
» You should write at least 150 words.

Sample Answer 1
The column graph compares the male and female teachers’ ratio in six different levels of educational institutions in the United Kingdom in 2010. As an overall trend, colleges and universities in the UK had more male lecturers while more female teachers were employed in lowers grades.
As can be seen from the diagram, the ratio of female instructors in the UK in 2010 was quite higher in the nursery and elementary levels as their percentage was around 90%. The female academics in secondary level was just above the half while an exact ratio of male and female lecturers could be observed in colleges. A contrasting scenario was visible in universities and private training institutes as male teachers dominated these two educational settings. In university level, 3 females were employed against 7 male mentors while this ratio was 4 by 5 in private institutes who provided training courses.
In summary, male teachers in the UK was higher in numbers in upper grades while this was completely opposite in primary and pre-school levels.
[Written by – Isabella]
Sample Answer 2
The bar chart shows the gender distribution of teachers teaching in six different levels of education in England in 2010.
In two of six grades, primary and pre-school, females much further outnumbered males as teachers. There was slightly different in secondary school level, in which women teacher’s number were still dominant. The percentage of the college teachers, both women and men, were equal. Males won in private training institute, by over 50%. There was a sharp gap in the university where the number of male teachers was higher than females, 70% male teachers against 30% female teachers.
Overall, the graph shows that in the UK, female teachers were famous in teaching from toddlers to secondary school. Meanwhile, male teachers were the highest percentage in teaching in the university and private training. In the college level, same numbers of male and female teachers were teaching in 2010 in the UK. The presented data depicts that male teachers mostly taught in higher level while more female teachers were teaching on the primary level.
[ Written by Nurul Izzah ]
Sample Answer 3
The bar chart gives information about the male and female tutors’ ratio in six distinct types of educational institutions in the UK in 2010.
Overall, female teachers were greater in number than the male teachers in junior levels of educational institutes. However, in higher education level, there were more male teachers than that of women teachers. In private training institutes, colleges and secondary schools, the ratio of teachers from both genders were quite similar.
According to the given illustration, there was a significant dissimilarity between the number of men and women educators in Nursery/Pre-school levels as well as primary schools. There were almost 98% and 96% female teachers in these two levels which show that the dominance of female teachers in early education level.
In the case of colleges, there was 50 percent male teachers and 50 percent of female teachers which show the equal number of teachers from both genders. In secondary level, the ratio of male teachers (about 47%) was slightly higher than that of female teachers (about 43%). Female teachers’ ration in private training institutes was higher than that of male teachers – about 47% female teachers against 43% male teachers. The male teachers in secondary schools were correlative to the female teachers of the private training institutions. In University level, there were 40% more male teachers than the women teachers.
[ Written by Harpreet Singh ]
