» You are advised to spend about 20 minutes on this task.
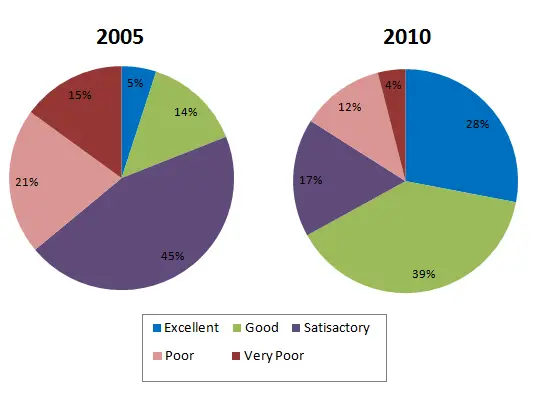
The charts below show the results of a questionnaire that asked visitors to the Parkway Hotel how they rated the hotel’s customer service. The same questionnaire was given to 100 guests in the years 2005 and 2010. Summarise the information by selecting and reporting the main features and make comparisons where relevant.
» You should write at least 150 words.

Sample Answer 1
The pie charts show the satisfaction levels of guests of the Parkway hotel regarding its customer service in 2005 and 2010. Overall, in 2010, the percentages of people who were contended about the customer service quality of this hotel increased considerably than that of 2005.
Now turning to the details, in 2005, almost every visitor out of five opined that the customer service of Parkway hotel was poor while 15% thought that it was very poor. Roughly half of the survey takers expressed their satisfaction regarding their experience with the hotel’s guest service and 14% said that it was good. One out of twenty such visitors were quite satisfied and they thought that the service was actually excellent.
Now getting back the survey result in 2010, it is evident that the percentages of happy guests out of 100 who expressed their opinion soared than that of five years earlier. 28% of them thought that the service was excellent which was around 6 times higher than the poll result of this same category in 2005. Guests who thought that the service was good accounted for 39, a great increase than that of 2005. Finally, the ratio of guests who were dissatisfied with the hotel’s guest service decreased considerably as well.
