• E-mail: admin@9ielts.com
  • Listening
    • IELTS Practice Tests
    • Recent Actual Tests
  • Reading
    • IELTS Practice Tests
    • Recent Actual Tests
  • Speaking
    • Speaking Part 1
    • Speaking Part 2
    • Speaking Part 3
  • Writing
    • General Training Writing Task 1
    • Academic Writing Task 1
      • Bar Chart
      • Line Graph
      • Pie Chart
      • Table
      • Map
      • Process Diagram
      • Mixed Charts
    • IELTS Writing Task 2
      • Advantages & Disadvantages Essays
      • Agree or Disagree Essays
      • Discuss Both Views Essays
      • Direct Questions Essays
      • Problems/Causes & Solutions Essays
  • Grammar
  • Vocabulary
    • Speaking Vocabulary
    • Writing Vocabulary
    • Collocations for IELTS
  • Books
  • Blog
No Result
View All Result
No Result
View All Result
Home IELTS Writing

Student expenditure over a three-year period in the United Kingdom

9IELTS by 9IELTS
July 18, 2022
in IELTS Writing, Academic Writing Task 1, Bar Chart
Reading Time: 3 mins read
9
VIEWS

» You should spend about 20 minutes on this task.

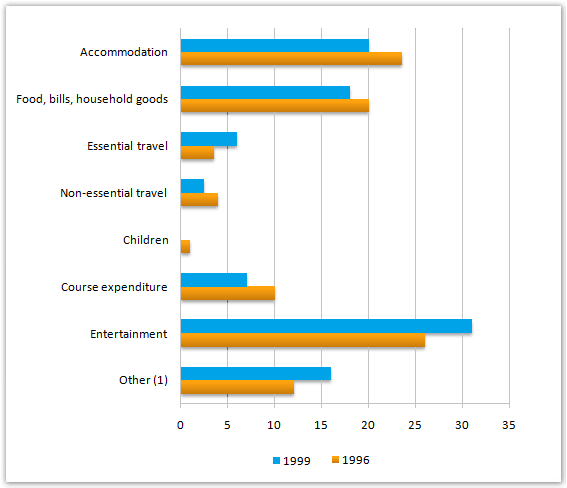
The chart shows student expenditure over a three-year period in the United Kingdom. Summarise the information by selecting and reporting the main features, and make comparisons where relevant.

» Write at least 150 words.

   Student expenditure (aged under 26 in higher education), United Kingdom *
student-expenditure-over-a-three-year-period-in-the-united-kingdom

(1) includes non-essential consumer items and credit repayments

* Source: Student Income and Expenditure Survey. Department for Education and Employment.

Sample Answer 1

The bar chart compares the expenses of students who were less than 26 years old and were in higher studies in the UK. It was presented based on the ‘Student Income and Expenditure Survey’ conducted by the Department for Education and Employment. The data is for the years 1996 and 1999 and the expenditures were classified into 7 main categories. Overall, expenses by those students on food, course fees, bills, accommodations and non-essential travels decreased whereas the amount spent on entertainment, credit repayment, and essential travels increased.

As the data suggests, entertainment drained the highest amount of money both in 1996 and 1999 and the expenses on food, accommodation, household goods, non-essential travels, and course decreased in 1999. Students in the UK spent 26% for entertainment in 1996 and after three years, it increased to 31%. They spent 23% for their accommodation in 1996 and it dipped to 20% in 1999.

A similar pattern can be observed for food, household goods, bills, course cost and non-essential travel for which students spent fewer percentages of their money. About 1% of total expenses were for children in 1996, possibly by students who were also parents. Moreover, in 1996, the expense for courses was 10%, and that decreased to 7% after three years. Non-essential consumer items and credit repayments were categories in ‘Other,’ and that comprised 12% of cost in 1996 whereas it increased by 4% in 1999.

Sample Answer 2

The given bar graph shows the expenditure of UK students for the years 1996 and 1999. As is observed from the given data, a large portion of total expenses by UK students was made for accommodation and entertainment.

The data were collected by the Department of Education and Employment from a survey for the given years, and it shows students’ expenses in 8 different categories. Initially, in 1996, around 23% of the expenses made by students were for housing, and more than 25% of their total expenses were made for entertainment purposes. In this year, they spent 20% on their food, household goods, and utility bills. Course expenses were 10% while travels (both essential and non-essential) made just over 10% of their total expense. Students, who had children, spent only 2% on their kids. All other expenses this year were less than 15% which included non-essential consumer items and credit repayments.

After three years, the expenses of accommodation decreased by 3% while the costs of entertainment increased by 5%. Interestingly the course expenditure in 1999 was less than that of 1996. Expenses for non-essential consumer items and credit card repayment increased by around 4%, while the cost of non-essential travel and daily livings got reduced.

Previous Post

Discuss the causes and effects of widespread drug use by young people

Next Post

How can children who are disinterested in study to be motivated

Leave a Reply Cancel reply

Your email address will not be published. Required fields are marked *

POPULAR POSTS

Cambridge IELTS 1-19 Book Series [PDF + Audio]

Cambridge IELTS 20 Academic [Update 2025]

Cambridge IELTS 19 Academic [PDF + Audio]

200 IELTS Speaking Sample Answers [PDF + Audio]

Cambridge IELTS 18 Academic [PDF + Audio]

IELTS Recent Actual Tests [Full PDF + Audio]

IELTS Listening Practice Test 204

IELTS Reading Practice Test 320

Cambridge IELTS 18 General Training [PDF + Audio]

Cambridge IELTS 17 General Training [PDF + Audio]

About Us

9ielts logo

9IELTS is dedicated to providing free materials and resources for IELTS conquerors. Stay constantly updated with a wide range of ultimate tips, strategies, and practice tests to crack the high-stakes IELTS exam!

Recent Posts

In which areas are computers more important

Consumer spending on different items in five different countries

Describe a funny text message you have once received

You have left a bag at the hotel

The differences in wheat exports over three different areas

Disclaimer

The information on this site is for informational purposes only. IELTS is a registered trademark of the University of Cambridge ESOL, the British Council, and IDP Education Australia. This site and its owners are not affiliated, approved or endorsed by University of Cambridge ESOL, the British Council, or IDP Education Australia.
  • About Us
  • Contact Us
  • Disclaimer
  • Terms & Conditions
  • Privacy Policy

© 2024 9IELTS. All Rights Reserved.

No Result
View All Result
  • Listening
    • IELTS Practice Tests
    • Recent Actual Tests
  • Reading
    • IELTS Practice Tests
    • Recent Actual Tests
  • Speaking
    • Speaking Part 1
    • Speaking Part 2
    • Speaking Part 3
  • Writing
    • General Training Writing Task 1
    • Academic Writing Task 1
      • Bar Chart
      • Line Graph
      • Pie Chart
      • Table
      • Map
      • Process Diagram
      • Mixed Charts
    • IELTS Writing Task 2
      • Advantages & Disadvantages Essays
      • Agree or Disagree Essays
      • Discuss Both Views Essays
      • Direct Questions Essays
      • Problems/Causes & Solutions Essays
  • Grammar
  • Vocabulary
    • Speaking Vocabulary
    • Writing Vocabulary
    • Collocations for IELTS
  • Books
  • Blog

© 2024 9IELTS. All Rights Reserved.