• E-mail: admin@9ielts.com
  • Listening
    • IELTS Practice Tests
    • Recent Actual Tests
  • Reading
    • IELTS Practice Tests
    • Recent Actual Tests
  • Speaking
    • Speaking Part 1
    • Speaking Part 2
    • Speaking Part 3
  • Writing
    • General Training Writing Task 1
    • Academic Writing Task 1
      • Bar Chart
      • Line Graph
      • Pie Chart
      • Table
      • Map
      • Process Diagram
      • Mixed Charts
    • IELTS Writing Task 2
      • Advantages & Disadvantages Essays
      • Agree or Disagree Essays
      • Discuss Both Views Essays
      • Direct Questions Essays
      • Problems/Causes & Solutions Essays
  • Grammar
  • Vocabulary
    • Speaking Vocabulary
    • Writing Vocabulary
    • Collocations for IELTS
  • Books
  • Blog
No Result
View All Result
No Result
View All Result
Home IELTS Writing

The average household expenditures in Japan and Malaysia

9IELTS by 9IELTS
July 18, 2022
in IELTS Writing, Academic Writing Task 1, Pie Chart
Reading Time: 2 mins read
95
VIEWS

» You are advised to spend about a maximum of 20 minutes on this task.

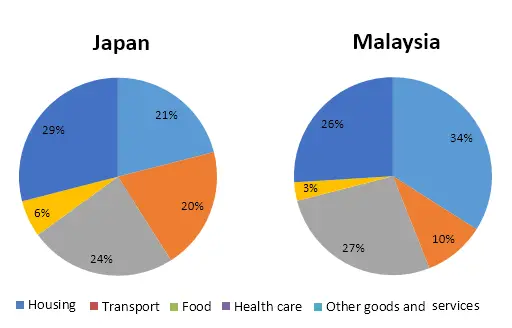
The pie charts below describe average household expenditures by major categories in Japan and Malaysia in 2010.  Write a report for a university lecturer describing the information shown.

» You should write at least 150 words.

The household expenditures in Japan and Malaysia

Sample Answer 1

The pie charts depict the proportions of money spent on households in Japan compared to Malaysia in 2010 based on five categories namely- housing, transportation, food, healthcare and other goods and services.

As illustrated, most of the expenditures in Japan was made on goods and other services, comprising 29% of the total expenditures compared to Malaysia, which only spends 26%. Food came as second priority for both countries with 24% and 27% of total household costs respectively. Housing in Japan is placed as the third priority with an average of 21% expenditure in comparison to Malaysia, which places their housing as their major expenditure. Furthermore, money spent for transportation fall as the fourth priority with an average of 20% in Japan and 10% in Malaysia. Lastly, healthcare was observed to be the least priority for both countries comprising 6% and 3% of the total expenditures.

Overall, pie charts indicate that the main expenses in both countries were on goods and services, food and housing, while transportation and healthcare were given least prioritised.

Sample Answer 2

The presented pie charts compare the expenses of Japanese and Malaysian people in five household categories in 2010. As can be seen from the given illustration, housing in Malaysia required just over one-third of the total cost while transportation in Japan demanded exactly the double cost than that in Malaysia on an average.

As is evident from the given diagrams, food expenditure in Malaysia (27%) was slightly higher than that of Japan (24%). Different goods and services required the highest expenditure for Japanese while it was food that cost the Malaysian the most. Heath care drained 6% money for an average Japanese which was exactly double than the cost in Malaysia. However, just over one-third of the money in Malaysia went on housing while it was just over one-fifth in Japan. Malaysian people spent 26% of their total cost for different service and goods which was 3% lower than that of Japan.

In summary, shelter, food and different commodities and service drained a lion share of a Malaysian’s earning while Japanese people spent more on products and service, foods, transport and housing in 2010. Finally, Japanese people had to spend more on medical services than that of Malaysians.

Previous Post

Percentages of home schooled students

Next Post

Sales made by a coffee shop

Leave a Reply Cancel reply

Your email address will not be published. Required fields are marked *

POPULAR POSTS

Cambridge IELTS 1-19 Book Series [PDF + Audio]

Cambridge IELTS 20 Academic [Update 2025]

Cambridge IELTS 19 Academic [PDF + Audio]

200 IELTS Speaking Sample Answers [PDF + Audio]

IELTS Recent Actual Tests [Full PDF + Audio]

Cambridge IELTS 18 Academic [PDF + Audio]

IELTS Listening Practice Test 204

IELTS Reading Practice Test 320

Cambridge IELTS 18 General Training [PDF + Audio]

Cambridge IELTS 17 General Training [PDF + Audio]

About Us

9ielts logo

9IELTS is dedicated to providing free materials and resources for IELTS conquerors. Stay constantly updated with a wide range of ultimate tips, strategies, and practice tests to crack the high-stakes IELTS exam!

Recent Posts

The key to solving the environmental problem is simple

Describe something you like doing during the winter

IELTS Speaking Part 3: Topic 18

IELTS Reading Practice Test 215

Describe a foreign film/movie you enjoyed so much

Disclaimer

The information on this site is for informational purposes only. IELTS is a registered trademark of the University of Cambridge ESOL, the British Council, and IDP Education Australia. This site and its owners are not affiliated, approved or endorsed by University of Cambridge ESOL, the British Council, or IDP Education Australia.
  • About Us
  • Contact Us
  • Disclaimer
  • Terms & Conditions
  • Privacy Policy

© 2024 9IELTS. All Rights Reserved.

No Result
View All Result
  • Listening
    • IELTS Practice Tests
    • Recent Actual Tests
  • Reading
    • IELTS Practice Tests
    • Recent Actual Tests
  • Speaking
    • Speaking Part 1
    • Speaking Part 2
    • Speaking Part 3
  • Writing
    • General Training Writing Task 1
    • Academic Writing Task 1
      • Bar Chart
      • Line Graph
      • Pie Chart
      • Table
      • Map
      • Process Diagram
      • Mixed Charts
    • IELTS Writing Task 2
      • Advantages & Disadvantages Essays
      • Agree or Disagree Essays
      • Discuss Both Views Essays
      • Direct Questions Essays
      • Problems/Causes & Solutions Essays
  • Grammar
  • Vocabulary
    • Speaking Vocabulary
    • Writing Vocabulary
    • Collocations for IELTS
  • Books
  • Blog

© 2024 9IELTS. All Rights Reserved.