• E-mail: [email protected]
  • Listening
    • Cambridge IELTS Tests
    • IELTS Practice Tests
    • Recent Actual Tests
  • Reading
    • Cambridge IELTS Tests
    • IELTS Practice Tests
    • Recent Actual Tests
  • Speaking
    • Speaking Part 1
    • Speaking Part 2
    • Speaking Part 3
  • Writing
    • General Training Writing Task 1
    • Academic Writing Task 1
      • Bar Chart
      • Line Graph
      • Pie Chart
      • Table
      • Map
      • Process Diagram
      • Mixed Charts
    • IELTS Writing Task 2
      • Advantages & Disadvantages Essays
      • Agree or Disagree Essays
      • Discuss Both Views Essays
      • Direct Questions Essays
      • Problems/Causes & Solutions Essays
  • Grammar
  • Vocabulary
    • Speaking Vocabulary
    • Writing Vocabulary
    • Collocation for IELTS
  • IELTS Books
  • Blog
No Result
View All Result
No Result
View All Result
Home IELTS Writing Academic Writing Task 1

The estimated literacy rates by region and gender for 2000-2004

9IELTS by 9IELTS
October 17, 2022
in Academic Writing Task 1, IELTS Writing, Table
Reading Time: 2 mins read
57
VIEWS

You should spend about 20 minutes on this task.

The table below shows the estimated literacy rates by region and gender for 2000-2004. Summarise the information by selecting and reporting the main features, and make comparisons where relevant.

Write at least 150 words.
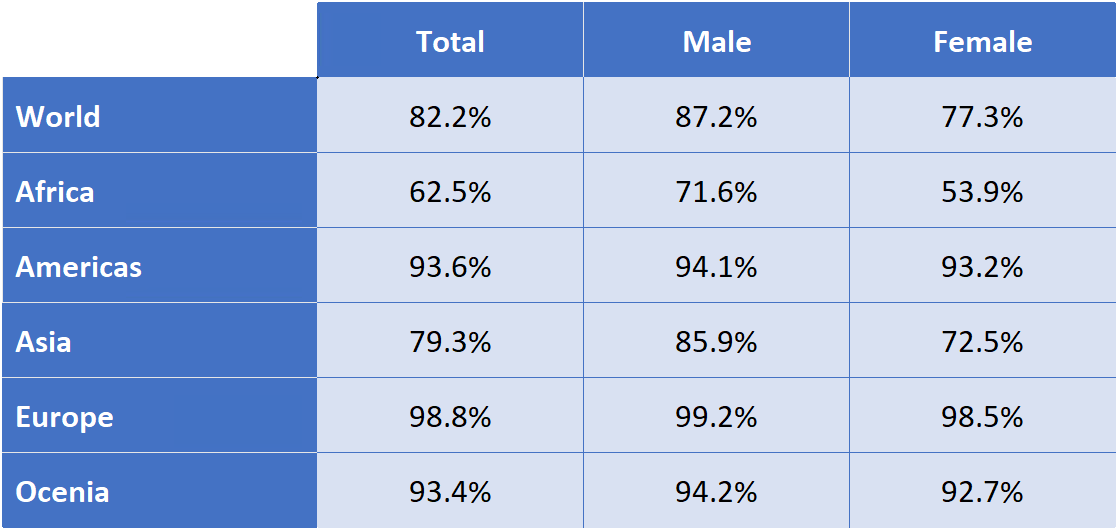
The estimated literacy rates by region and gender for 2000-2004

Sample Answer

The table shows estimated literacy rates for men and women in 2000-2004 in five regions: Africa, the Americas, Asia, Europe and Oceania. It also shows average world literacy rates for both genders for the same years.

According to the table, Europe has the highest literacy rates, reaching almost 99%. There is virtually no difference in literacy rates for European men and women.

In Oceania and the Americas, the figures for both men and women are almost the same. In both regions over 93% of the population is literate.

In both Asia and Africa, there are considerable differences in literacy rates between men and women. In Asia, only 72.5% of women are literate, whereas the figure for Asian men is 13% higher. In Africa, the gap is nearly double, with 53.9% of all African women being literate and 71.6% of the African men being able to read and write.

Overall, around 82% of the world population is literate. In Europe, Oceania and the Americas the literacy rates are the highest, with over 90% of the population able to read and write. Asia and Africa have lower literacy rates than the other regions in the graph.

(194 words)

Previous Post

Projections for global production by sector in 2040 and 2060

Next Post

The percentage of women going into higher education in five countries

Leave a Reply

Your email address will not be published. Required fields are marked *

POPULAR POSTS

The experience of non academic life offers benefits for individual

Describe an activity you do to stay healthy

What Are Nouns?

The main reason people go to work is to earn money

Cambridge IELTS 15 Reading Test 1

Many people go to university for academic study

Describe a movie you would like to watch again

Describe a time when you started using a new technological device

Describe an occasion when you had some incorrect information

Describe something important you have learned recently

About Us

9IELTS

9IELTS is dedicated to providing free materials and resources for IELTS conquerors. Stay constantly updated with a wide range of ultimate tips, strategies, and practice tests to crack the high-stakes IELTS exam!

Recent Posts

Describe any public event that you attended

You want to sell your television

IELTS Reading Practice Test 216

Nowadays we are living in a throw-away society

While studying some students take weekend or evening jobs

Disclaimer

The information on this site is for informational purposes only. IELTS is a registered trademark of the University of Cambridge ESOL, the British Council, and IDP Education Australia. This site and its owner are not affiliated, approved or endorsed by University of Cambridge ESOL, the British Council, or IDP Education Australia.
  • About Us
  • Contact Us
  • Disclaimer
  • Terms & Conditions
  • Privacy Policy

Copyright © 2023 9IELTS. All Rights Reserved.

No Result
View All Result
  • Listening
    • Cambridge IELTS Tests
    • IELTS Practice Tests
    • Recent Actual Tests
  • Reading
    • Cambridge IELTS Tests
    • IELTS Practice Tests
    • Recent Actual Tests
  • Speaking
    • Speaking Part 1
    • Speaking Part 2
    • Speaking Part 3
  • Writing
    • General Training Writing Task 1
    • Academic Writing Task 1
      • Bar Chart
      • Line Graph
      • Pie Chart
      • Table
      • Map
      • Process Diagram
      • Mixed Charts
    • IELTS Writing Task 2
      • Advantages & Disadvantages Essays
      • Agree or Disagree Essays
      • Discuss Both Views Essays
      • Direct Questions Essays
      • Problems/Causes & Solutions Essays
  • Grammar
  • Vocabulary
    • Speaking Vocabulary
    • Writing Vocabulary
    • Collocation for IELTS
  • IELTS Books
  • Blog

Copyright © 2023 9IELTS. All Rights Reserved.

This site uses cookies to offer you a better browsing experience. By continuing to use this website, you agree to our Privacy Policy.