You should spend about 20 minutes on this task.
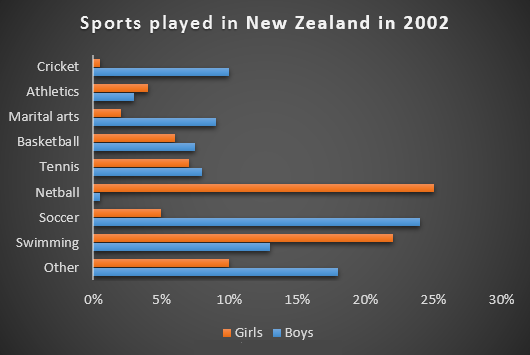
The chart below gives information about the most common sports played in New Zealand in 2002.
Summarise the information by selecting and reporting the main features, and make comparisons where relevant.
Write at least 150 words.

Sample Answer 1
The bar graph provides information about the most common sports played in New Zealand in 2002. It gives figures for both boys and girls and clearly shows that their participation in sports is relatively equal. However, their sporting preferences tend to be different.
The graph shows that the most popular sport among girls is netball, with participation rates reaching 25 per cent. A similar percentage of boys prefer soccer, which is their favourite sport. Ten per cent of boys also enjoy playing cricket, but hardly any girls take part in this game. While swimming is popular among boys and girls, fewer boys participate in this sport – about 13 per cent compared to approximately 22 per cent of girls.
Sports, such as tennis, basketball and martial arts, have lower levels of popularity, and a significant percentage of boys and girls say they enjoy sports not referred to on the chart.
Sample Answer 2
The chart illustrates the proportions of boys and girls who participated in various sports in New Zealand in 2002.
Overall, it is clear that there was a difference between the percentage of boys and girls who took part in most of these sports. However, the proportion who played basketball and tennis was similar.
Among girls, around 25% played netball and a slightly lower percentage – 22% – enjoyed swimming. Approximately 8% and 7% of girls played tennis and basketball, respectively. Those figures were only negligible lower than boys for both sports. While 6% of girls played soccer and 5% participated in athletics, less than 5% of girls took part in martial arts and cricket. Finally, participation in other, unspecified sports totalled roughly 10%.
By contrast, among boys, only 1% played netball. The sports with the highest participation figures were soccer, swimming, and cricket, with 25%, 13%, and 12%, respectively. These were followed by cricket, martial arts, tennis, and basketball, which all had figures between 11% and 8%. About 18% of boys played other sports.
Sample Answer 3
The bar chart compares the proportion of boys and girls participating in various sports in New Zealand in 2002. Overall, it is apparent that there were significant differences in the percentage of boys and girls who took part in most of these sports. In contrast, basketball and tennis experienced a similar figure in both genders.
Among girls, the most common sports were netball and swimming, which comprised over 25% and 23%, respectively, followed by tennis, basketball, and athletics, which all had a figure of under 10%. By contrast, cricket and modern arts were the least common activities chosen by girls, representing a mere 1% and 2% in that order. Finally, 10% of girls took part in other activities.
Regarding the figure for boys, the sports with the highest participation were soccer, swimming, and cricket, with 25%, 13%, and 12%, respectively. Meanwhile, martial arts, basketball, and tennis were in the next position, which all had a figure between 8% and 11%. In stark contrast, the most striking feature from the chart is that fewer boys participated in athletics and netball than girls did, which were only 3% and 1%, compared to 5% and 21% of girls in that order. About 18% of boys played other sports.
Sample Answer 4
The bar graph provides information about the interest in sports activities of boys and girls in New Zealand during 2002.
The striking feature of the bar graph is that in most sports, the percentage of boys was more than that of girls; however, in netball, girls dominated boys with a more significant difference.
A vast difference was seen in the percentage of boys and girls playing netball. In detail, the percentage of boys in netball was around 25, whereas girls were only 1%. Similarly, boys dominated girls in swimming too, as their percentage was around 22% and girls were only 14 per Cent. On the other hand, girls outplayed boys in Soccer and other activities as their percentage was around 24 and 18, approximately 19 and 8 per cent than boys.
Moving further to other Sports, girls’ participation was also higher in athletics; however, in the rest of the games, boys were more interested than girls. A similar proportion (roughly 7- 8%) of boys participated in Basketball and tennis, and the proportion of girls in these sports also didn’t change much. It is fascinating to notice that 20% of boys collectively preferred cricket and martial arts; however, girls’ preference for these sports was negligible.
