» You should spend about 20 minutes on this task.
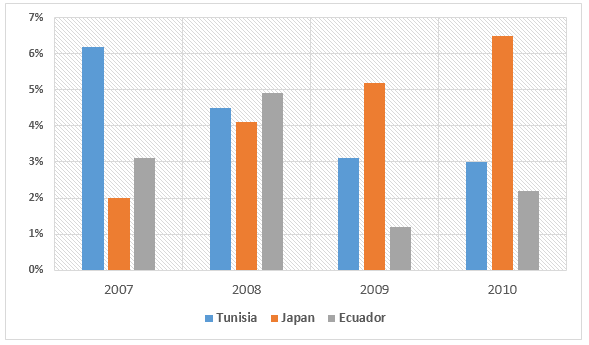
The chart below shows the GDP growth per year for three countries between 2007 and 2010. Summarise the information by selecting and reporting the main features, and make comparisons where relevant.

» Write at least 150 words.
Sample Answer 1
The provided bar chart shows data on the annual GDP of Tunisia, Japan and Ecuador between 2007 and 2010. As is observed from the given data, the annual GDP growth of Tunisia and Ecuador had decreased while the percentage of GDP had increased remarkably in Japan.
As is given in the bar graph, initially in 2007, the annual percentage of GDP growth in Tunisia was over 6 while this was only 2% in Japan and just over 3% in Ecuador. Within three years, this GDP growth in Tunisia decreased to 3%, which is less than half of its initial percentage. In Ecuador, the GDP growth percentage also declined and fell to about 2%. On the contrary, Japan had increased its annual GDP growth, and the percentage increased to well over 6 in 2010 compared to only 2% in 2007.
In summary, the annual GDP growth in Tunisia and Ecuador decreased while it increased remarkably in Japan over the given period.
Sample Answer 2
The chart gives data about the yearly rate of GDP growth in Tunisia, Japan and Ecuador from 2007 to 2010
It can be seen that the rate of GDP growth in Japan increased steadily while the figures for the other two nations experienced a decline over the period.
Looking at the chart in more detail, the Japanese yearly rate of growth in GDP experienced a gradual upturn, from 2% in the year 2007 to just under 7% in 2010. Meanwhile, there was a non-stop decrease in Tunisia’s figures through the years, from approximately 6% to only 3%, which was much lower than that of Japan.
Starting at 3% during the first year of the period, the percentage of GDP growth in Ecuador rose to over 4% in the next year, followed by a significant drop to only 1% in 2009. This figure soon recovered to roughly 2% in 2010, which was the lowest among the three countries.
Sample Answer 3
The bar graph compares the GDP growth between Tunisia, Japan and Ecuador for the three years from 2007 to 2010. In general, it is obvious that, over the given period, the GDP growth in Tunisia had a downward trend, while there was an upward trend in Japan.
If we look at the data given in a specific way, in 2007, Tunisia boosted its’ highest GDP growth at over 6%, whereas the other two
countries were merely at about 2-3%. However, the following year, Tunisia saw a significant drop by 2% reaching the more or less the same level of the GDP growth with Japan and Ecuador, as their GDP growth had increased considerably to 4% and 5% respectively.
After that, Japan continued to rise, hitting a peak of 6% in 2010. In contrast, there was a constant decline in Tunisia to 3% by 2010. Even though Ecuador recovered from its’ lowest (just over 1% in 2009), it still showed the lowest GDP growth among the three countries with approximately 2% in 2010.
