• E-mail: [email protected]
  • Listening
    • Cambridge IELTS Tests
    • IELTS Practice Tests
    • Recent Actual Tests
  • Reading
    • Cambridge IELTS Tests
    • IELTS Practice Tests
    • Recent Actual Tests
  • Speaking
    • Speaking Part 1
    • Speaking Part 2
    • Speaking Part 3
  • Writing
    • General Training Writing Task 1
    • Academic Writing Task 1
      • Bar Chart
      • Line Graph
      • Pie Chart
      • Table
      • Map
      • Process Diagram
      • Mixed Charts
    • IELTS Writing Task 2
      • Advantages & Disadvantages Essays
      • Agree or Disagree Essays
      • Discuss Both Views Essays
      • Direct Questions Essays
      • Problems/Causes & Solutions Essays
  • Grammar
  • Vocabulary
    • Speaking Vocabulary
    • Writing Vocabulary
    • Collocation for IELTS
  • IELTS Books
  • Blog
No Result
View All Result
No Result
View All Result
Home IELTS Writing

The GDP growth per year for three countries between 2007 and 2010

9IELTS by 9IELTS
October 12, 2022
in IELTS Writing, Academic Writing Task 1, Bar Chart
Reading Time: 3 mins read
16
VIEWS

» You should spend about 20 minutes on this task.

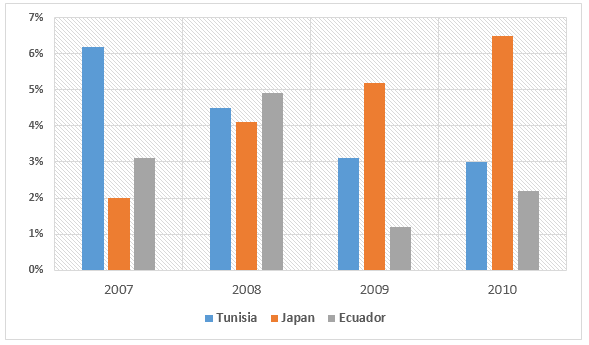
The chart below shows the GDP growth per year for three countries between 2007 and 2010. Summarise the information by selecting and reporting the main features, and make comparisons where relevant.

gdp-growth-per-year-for-three-countries

» Write at least 150 words.

Sample Answer 1

The provided bar chart shows data on the annual GDP of Tunisia, Japan and Ecuador between 2007 and 2010. As is observed from the given data, the annual GDP growth of Tunisia and Ecuador had decreased while the percentage of GDP had increased remarkably in Japan.

As is given in the bar graph, initially in 2007, the annual percentage of GDP growth in Tunisia was over 6 while this was only 2% in Japan and just over 3% in Ecuador. Within three years, this GDP growth in Tunisia decreased to 3%, which is less than half of its initial percentage. In Ecuador, the GDP growth percentage also declined and fell to about 2%. On the contrary, Japan had increased its annual GDP growth, and the percentage increased to well over 6 in 2010 compared to only 2% in 2007.

In summary, the annual GDP growth in Tunisia and Ecuador decreased while it increased remarkably in Japan over the given period.

Sample Answer 2

The chart gives data about the yearly rate of GDP growth in Tunisia, Japan and Ecuador from 2007 to 2010

It can be seen that the rate of GDP growth in Japan increased steadily while the figures for the other two nations experienced a decline over the period.

Looking at the chart in more detail, the Japanese yearly rate of growth in GDP experienced a gradual upturn, from 2% in the year 2007 to just under 7% in 2010. Meanwhile, there was a non-stop decrease in Tunisia’s figures through the years, from approximately 6% to only 3%, which was much lower than that of Japan.

Starting at 3% during the first year of the period, the percentage of GDP growth in Ecuador rose to over 4% in the next year, followed by a significant drop to only 1% in 2009. This figure soon recovered to roughly 2% in 2010, which was the lowest among the three countries.

Sample Answer 3

The bar graph compares the GDP growth between Tunisia, Japan and Ecuador for the three years from 2007 to 2010. In general, it is obvious that, over the given period, the GDP growth in Tunisia had a downward trend, while there was an upward trend in Japan.

If we look at the data given in a specific way, in 2007, Tunisia boosted its’ highest GDP growth at over 6%, whereas the other two
countries were merely at about 2-3%. However, the following year, Tunisia saw a significant drop by 2% reaching the more or less the same level of the GDP growth with Japan and Ecuador, as their GDP growth had increased considerably to 4% and 5% respectively.

After that, Japan continued to rise, hitting a peak of 6% in 2010. In contrast, there was a constant decline in Tunisia to 3% by 2010. Even though Ecuador recovered from its’ lowest (just over 1% in 2009), it still showed the lowest GDP growth among the three countries with approximately 2% in 2010.

Previous Post

Why do you think people attend colleges or universities

Next Post

Is this dependence on computers a good thing

Leave a Reply

Your email address will not be published. Required fields are marked *

POPULAR POSTS

Describe a Time When You Helped a Stranger 

IELTS Listening Practice Test 49

Describe an item of clothing you purchased that you did not like

Parents are the best teachers

Young people have gained status and power but old people have lost

High schools should allow students to study the courses that students want to study

Music is as important as other subjects in schools

Describe a Country that You Want to Visit

IELTS Reading Practice Test 01

Nearly every new building is designed by an architect nowadays

About Us

9IELTS

9IELTS is dedicated to providing free materials and resources for IELTS conquerors. Stay constantly updated with a wide range of ultimate tips, strategies, and practice tests to crack the high-stakes IELTS exam!

Recent Posts

International tourism and international trade are two important aspects

Hard work and determination bring success

That it is good for a country’s culture to import foreign movies and TV programmes

Describe a situation when others didn’t tell you the whole truth

Describe a vehicle that you would like to buy

Disclaimer

The information on this site is for informational purposes only. IELTS is a registered trademark of the University of Cambridge ESOL, the British Council, and IDP Education Australia. This site and its owner are not affiliated, approved or endorsed by University of Cambridge ESOL, the British Council, or IDP Education Australia.
  • About Us
  • Contact Us
  • Disclaimer
  • Terms & Conditions
  • Privacy Policy

Copyright © 2023 9IELTS. All Rights Reserved.

No Result
View All Result
  • Listening
    • Cambridge IELTS Tests
    • IELTS Practice Tests
    • Recent Actual Tests
  • Reading
    • Cambridge IELTS Tests
    • IELTS Practice Tests
    • Recent Actual Tests
  • Speaking
    • Speaking Part 1
    • Speaking Part 2
    • Speaking Part 3
  • Writing
    • General Training Writing Task 1
    • Academic Writing Task 1
      • Bar Chart
      • Line Graph
      • Pie Chart
      • Table
      • Map
      • Process Diagram
      • Mixed Charts
    • IELTS Writing Task 2
      • Advantages & Disadvantages Essays
      • Agree or Disagree Essays
      • Discuss Both Views Essays
      • Direct Questions Essays
      • Problems/Causes & Solutions Essays
  • Grammar
  • Vocabulary
    • Speaking Vocabulary
    • Writing Vocabulary
    • Collocation for IELTS
  • IELTS Books
  • Blog

Copyright © 2023 9IELTS. All Rights Reserved.

This site uses cookies to offer you a better browsing experience. By continuing to use this website, you agree to our Privacy Policy.