• E-mail: admin@9ielts.com
  • Listening
    • Cambridge IELTS Tests
    • IELTS Practice Tests
    • Recent Actual Tests
  • Reading
    • Cambridge IELTS Tests
    • IELTS Practice Tests
    • Recent Actual Tests
  • Speaking
    • Speaking Part 1
    • Speaking Part 2
    • Speaking Part 3
  • Writing
    • General Training Writing Task 1
    • Academic Writing Task 1
      • Bar Chart
      • Line Graph
      • Pie Chart
      • Table
      • Map
      • Process Diagram
      • Mixed Charts
    • IELTS Writing Task 2
      • Advantages & Disadvantages Essays
      • Agree or Disagree Essays
      • Discuss Both Views Essays
      • Direct Questions Essays
      • Problems/Causes & Solutions Essays
  • Grammar
  • Vocabulary
    • Speaking Vocabulary
    • Writing Vocabulary
    • Collocation for IELTS
  • IELTS Books
  • Blog
No Result
View All Result
No Result
View All Result
Home IELTS Writing

Bar chart shows the global sales of televisions

9IELTS by 9IELTS
October 17, 2022
in IELTS Writing, Academic Writing Task 1, Bar Chart
Reading Time: 2 mins read
24
VIEWS

» You should spend about 20 minutes on this task.

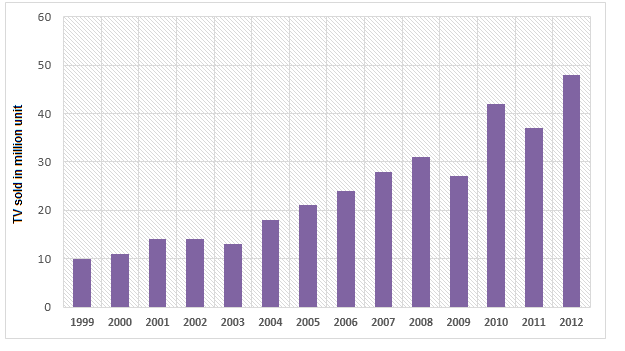
The bar chart below shows the global sales of televisions by Supervision Incorporation from 1999 to 2012. Summarise the information by selecting and reporting the main features, and make comparisons where relevant.

» You should write at least 150 words.

Television Sales by Supervision Incorporation (in millions)
Bar chart shows the global sales of televisions

Sample Answer

The bar chart presents data on the global TV sales from 1999 to 2012, over a period of 14 years, by the Supervision Incorporation. The sales volume is given in million units and it is obvious that sales amount of this company increased with some fluctuations over the time.

Getting back to the details, 10 million TVs were sold by Supervision Incorporation worldwide in 1999 and it increased by 3 to 5 million in 2002 and 2003. The sales amount dropped a bit in the next year and then rose again in 2004 with a figure of nearly 20 million sales. From this point, there was a steady progress in the television sales and the number went over 30 million in 2008. The company witnessed a decline in its sales in 2009 compared to the previous year’s sale. The global TV sales in 2010 by this manufacturer went well over 40 million which was just double than that of 2005. Finally, with a slight dip in 2011, the sales volume of TVs by this company in 2012 reached to around 48.5 million.

Previous Post

Journey by different means in 4 countries

Next Post

Researchers in technology per million people in five countries

Leave a Reply Cancel reply

Your email address will not be published. Required fields are marked *

POPULAR POSTS

Describe a memorable childhood experience

Advantages and disadvantages of shopping in larger shopping centers

Internet as a way of opening up new communication

Government should envisage other means for commuters

IELTS Life Skills Official Cambridge Test Practice B1 with Answers

Hawaiian island chain in the centre of the Pacific Ocean

Schools are spending more time teaching traditional subjects

IELTS Listening Practice Test 102

Buying things on the Internet is becoming more and more popular

Some people regard the video games as harmless fun

About Us

9ielts-logo

9IELTS is dedicated to providing free materials and resources for IELTS conquerors. Stay constantly updated with a wide range of ultimate tips, strategies, and practice tests to crack the high-stakes IELTS exam!

Recent Posts

In the past, knowledge was contained in books. Nowadays, knowledge is uploaded to the internet

Collins Practice Tests for IELTS 1, 2, 3 [PDF + Audio]

IELTS Speaking Part 3: Topic 17

In the past, most people worked for small businesses, while more people now work for large businesses

Describe a house or an apartment you would like to live in

Disclaimer

The information on this site is for informational purposes only. IELTS is a registered trademark of the University of Cambridge ESOL, the British Council, and IDP Education Australia. This site and its owner are not affiliated, approved or endorsed by University of Cambridge ESOL, the British Council, or IDP Education Australia.
  • About Us
  • Contact Us
  • Disclaimer
  • Terms & Conditions
  • Privacy Policy

© 2023 9IELTS. All Rights Reserved.

No Result
View All Result
  • Listening
    • Cambridge IELTS Tests
    • IELTS Practice Tests
    • Recent Actual Tests
  • Reading
    • Cambridge IELTS Tests
    • IELTS Practice Tests
    • Recent Actual Tests
  • Speaking
    • Speaking Part 1
    • Speaking Part 2
    • Speaking Part 3
  • Writing
    • General Training Writing Task 1
    • Academic Writing Task 1
      • Bar Chart
      • Line Graph
      • Pie Chart
      • Table
      • Map
      • Process Diagram
      • Mixed Charts
    • IELTS Writing Task 2
      • Advantages & Disadvantages Essays
      • Agree or Disagree Essays
      • Discuss Both Views Essays
      • Direct Questions Essays
      • Problems/Causes & Solutions Essays
  • Grammar
  • Vocabulary
    • Speaking Vocabulary
    • Writing Vocabulary
    • Collocation for IELTS
  • IELTS Books
  • Blog

© 2023 9IELTS. All Rights Reserved.

This site uses cookies to offer you a better browsing experience. By continuing to use this website, you agree to our Privacy Policy.