• E-mail: admin@9ielts.com
  • Listening
    • IELTS Practice Tests
    • Recent Actual Tests
  • Reading
    • IELTS Practice Tests
    • Recent Actual Tests
  • Speaking
    • Speaking Part 1
    • Speaking Part 2
    • Speaking Part 3
  • Writing
    • General Training Writing Task 1
    • Academic Writing Task 1
      • Bar Chart
      • Line Graph
      • Pie Chart
      • Table
      • Map
      • Process Diagram
      • Mixed Charts
    • IELTS Writing Task 2
      • Advantages & Disadvantages Essays
      • Agree or Disagree Essays
      • Discuss Both Views Essays
      • Direct Questions Essays
      • Problems/Causes & Solutions Essays
  • Grammar
  • Vocabulary
    • Speaking Vocabulary
    • Writing Vocabulary
    • Collocations for IELTS
  • Books
  • Blog
No Result
View All Result
No Result
View All Result
Home IELTS Writing

Estimated sales of gold in Dubai for 12 months

9IELTS by 9IELTS
July 18, 2022
in IELTS Writing, Academic Writing Task 1
Reading Time: 3 mins read
24
VIEWS

» You should spend about 20 minutes on this task.

The line graph shows estimated sales of gold in Dubai for 12 months in 2002 in millions of Dirhams. Write a report describing the information in the graph below.

» You should write at least 150 words.
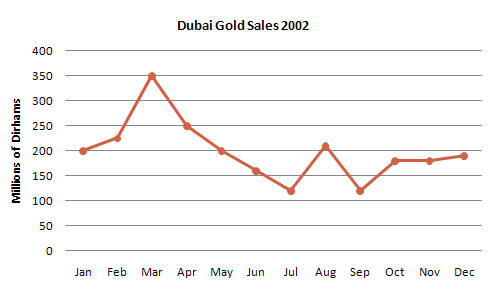
 

Estimated sales of gold in Dubai for 12 months.1

Model Answer 1:


The line graph shows monthly gold sales in Dubai throughout 2012. The sales amount is given in million Dirhams for every month in 2012. A glance at the diagram reveals that in March the sale amount was highest and average monthly sale of gold was between 100 and 200 million Dirhams.

According to the line graph, total sales of gold was 200 million Dirhams in January 2002 in Dubai and this amount rapidly increased in the next two months. In March, the sales amounted 350 million Dirhams, the highest in the year but afterwards, the sales amount steadily declined till July when the gold sale was recorded at just over 110 million Dirhams. August’s gold sale went abruptly higher, over 200 million but dropped suddenly to 110 million. Sales of gold climbed in the next month, October but remained almost stable for the rest of the year at around 170-180 million Dirhams. At the end of the year, Dubai gold sale was recorded at approximately 185 million Dirhams, almost same as it was at the beginning of the year.         

Sample Answer 2:


The given line graph shows data on Gold sales in Dubai from January to December of 2002. As is presented in the illustration, the highest amounts of sales were done in March, and the lowest sales were in July and September.

As is presented in the line graph, initially, in January 2002, two hundred million of Dirham Gold was sold in January, and this amount kept increasing for the next two months, and in March it reached 350 million, which is the largest amount throughout the whole year. After that, the sales volume keeps declining steadily and reached 110 million in July. With some fluctuations, the sale amount reached to 200 million in August and finally, in December, it totalled about 200 million.

In summary, Mars was the best month for Dubai Gold sales in the year 2002, and throughout the year, the sale volume fluctuated, keeping an approximate average of 180 million of Dirham per month.

( This model answer can be followed as an example of a very good answer. However, please note that this is just one example out of many possible approaches.)

Model Answer 3:


The given line graph compares the gold sales in Dubai from January 2002 to December 2002. The sale price is given in million of Dirham and it is evident from the diagram that gold sales in Dubai was highest in March while it was lowest in July & September.

According to the given illustration, the gold sale in Dubai was 200 million Dirham in January in the given year and it increased to around 230 million Dirham in the next month. The highest sale of gold was in March, amounting 350 million. From April to July, the sales amount kept on decreasing and reached to the lowest level in July with just above 100 million Dirham. In August the sale was just above 200 million and after that, the sales amount of Dubai gold showed some fluctuations. In September the sales amount again reached the lowest point, while at the end of the year, December 2012, the sale was just below 200 million Dirham.

Previous Post

Factors related to academic success in high-school students

Next Post

People work hard to buy more things in life

Leave a Reply Cancel reply

Your email address will not be published. Required fields are marked *

POPULAR POSTS

Cambridge IELTS 1-19 Book Series [PDF + Audio]

Cambridge IELTS 20 Academic [Update 2025]

Cambridge IELTS 19 Academic [PDF + Audio]

200 IELTS Speaking Sample Answers [PDF + Audio]

IELTS Recent Actual Tests [Full PDF + Audio]

Cambridge IELTS 18 Academic [PDF + Audio]

IELTS Listening Practice Test 204

IELTS Reading Practice Test 320

Cambridge IELTS 18 General Training [PDF + Audio]

Cambridge IELTS 17 General Training [PDF + Audio]

About Us

9ielts logo

9IELTS is dedicated to providing free materials and resources for IELTS conquerors. Stay constantly updated with a wide range of ultimate tips, strategies, and practice tests to crack the high-stakes IELTS exam!

Recent Posts

Parents need not to read or tell stories to children

Students should pay the full cost of their own university studies

Celebrities are more famous for their glamour and wealth than for their achievements

You are going on holiday and you would like to hire a car

Describe your favourite newspaper /magazine

Disclaimer

The information on this site is for informational purposes only. IELTS is a registered trademark of the University of Cambridge ESOL, the British Council, and IDP Education Australia. This site and its owners are not affiliated, approved or endorsed by University of Cambridge ESOL, the British Council, or IDP Education Australia.
  • About Us
  • Contact Us
  • Disclaimer
  • Terms & Conditions
  • Privacy Policy

© 2024 9IELTS. All Rights Reserved.

No Result
View All Result
  • Listening
    • IELTS Practice Tests
    • Recent Actual Tests
  • Reading
    • IELTS Practice Tests
    • Recent Actual Tests
  • Speaking
    • Speaking Part 1
    • Speaking Part 2
    • Speaking Part 3
  • Writing
    • General Training Writing Task 1
    • Academic Writing Task 1
      • Bar Chart
      • Line Graph
      • Pie Chart
      • Table
      • Map
      • Process Diagram
      • Mixed Charts
    • IELTS Writing Task 2
      • Advantages & Disadvantages Essays
      • Agree or Disagree Essays
      • Discuss Both Views Essays
      • Direct Questions Essays
      • Problems/Causes & Solutions Essays
  • Grammar
  • Vocabulary
    • Speaking Vocabulary
    • Writing Vocabulary
    • Collocations for IELTS
  • Books
  • Blog

© 2024 9IELTS. All Rights Reserved.