» You should spend about 20 minutes on this task.
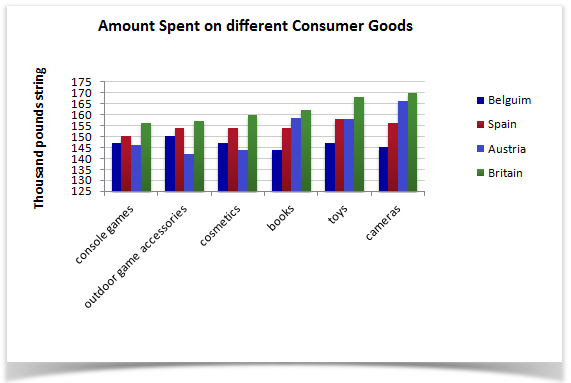
The bar chart below gives information about four countries spending habits of shopping on consumer goods in 2012.
Summarise the information by selecting and reporting the main features, and make comparisons where relevant.
» Write at least 150 words.
Sample Answer 1:
The vertical bar chart depicts the spending patterns of Belgians, Spaniards, Austrians and Brits on six commodities in 2012. Overall, Brits spent higher amount for purchasing these goods while books, toys and cameras cost these nations higher than gaming consoles, outdoor gaming accessories and cosmetics did.
As the data suggests, British spend just over 155 thousand pound sterling on console games in 2012 while other three nations spent between 145 to 150 thousand each. To buy outdoor sports equipment, English disbursed roughly 156 thousand, a close tie with that of Spaniards’ spending. Austrians spent the lowest to have such accessories in this year.
Moving further, people in Belgium and Austria purchased around 145 thousand pound’s of cosmetics while this amount in Spain and Britain was roughly 10 and 15 thousand higher. It is worth noticing that Brits spent the highest amount to own these items in 2012 and their greater ratio of expense accounted for purchasing toys and cameras. Books cost more than 160 thousand to English while it was lowest for Belgians, somewhat 15 thousand less.
These nations interest in owning toys and cameras showed a similar pattern and Austrians preferred spending for cameras more than they did for toys. British spend between 167 to 170 thousand for each of these two products and Austrian spent the least, approximately 145 thousand pound sterling.
Sample Answer 2:
The supplied bar chart compares the expenditure on consumer goods by the shoppers of four different countries namely Belgium, Spain, Austria and Britain for the year 2012. The chart shows the expenses in thousands of pounds for six main consumer goods. As is presented in the graph, British people spent the highest amount while citizens of Belgium seems like spent the least amount in for the given six consumer products.
For console games, citizens of these four countries expended around 150 thousand pounds on an average and British people spent more than other nations. The expenditure for outdoor game accessories was almost similar to the expenditure of console games. For the cosmetics, again British people spent more than other nations and the average expense was close to the game devices (console and outdoor). Similar expense pattern can be observed for the books and people of Belgium spent the least amount on books among the four nations. The highest expenditure made by the given four nations was in camera and the expenses made by British, Austrian, Spain and Belgian were approximately 170, 166, 156 and 145 thousand pounds consecutively. These nations spent a little less on toys, which was the second most expenditure category.
Sample Answer 3:
The bar chart compares the consumer spending on six different items in four countries in 2012. A glance at the graph reveals that Brtish spent the highest amount for purchasing these consumer goods in 2012.
As the data presents, in 2012, Spaniards spent exactly 150 thousand pound sterling to buy console games, which cost roughly 145 thousand for Belgian and Austrian consumers. Brits spent the highest amount on gaming consoles and it was over 165 million. For outdoor gaming accessories, English spent slightly more than that when Austrians spending was the least, 140 million.
Furthermore, Books cost around 160 million for British and Austrians while it was 15 million less for Belgians. Besides, Toys cost equally to the citizens of Spain and Austria, 157 roughly, Spaniards spending on these items were somewhat close.
It is worth noticing that, English consumers disbursed the highest amount on all these consumer goods and their maximum spending was for cameras, 170 million pound. Belgian consumers seem like spent the least and their major share of spending went on outdoor game accessories for which they paid 150 million. Finally, toys and cameras cost the highest for the customers in these countries in 2012.