The unemployment rates in the US and Japan
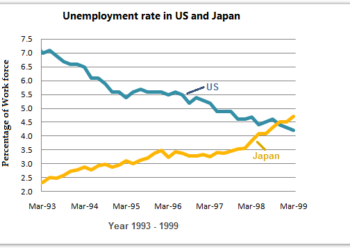
» You should spend about 20 minutes on this task. The graph below shows the unemployment rates in the US and Japan between...
» You should spend about 20 minutes on this task. The graph below shows the unemployment rates in the US and Japan between...

» You should spend about 20 minutes on this task. The charts below show the levels of participation in education and science in...
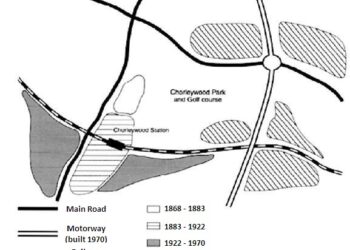
» You should write at least 150 words. Chorleywood is a village near London whose population has increased steadily since the middle of...
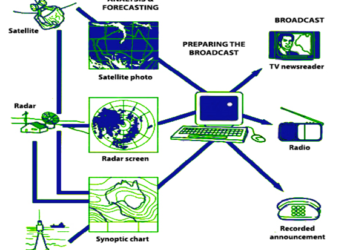
You should spend about 20 minutes on this task. The diagram below shows how the Australian Bureau of Meteorology collects up-to-the-minute information on...
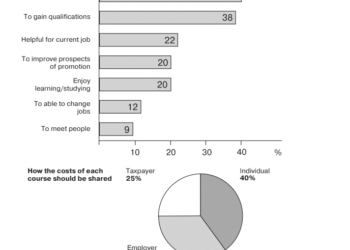
» You should spend 20 minutes on this task. The charts below show the results of a survey of adult education. The first chart...
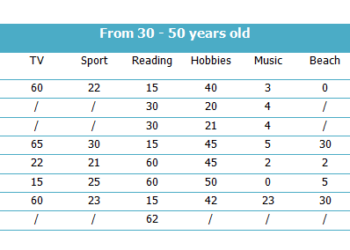
» You should spend about 20 minutes on this task. The table below gives information about favourite pastimes in different countries. Summarise the...
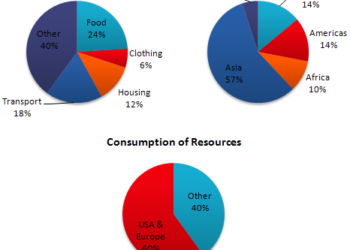
» You should spend about 20 minutes on this task. The pie charts below give data on the spending and consumption of resources...
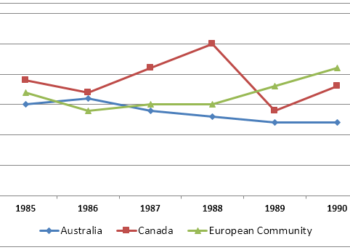
» You should spend about 20 minutes on this task. The graph below shows the differences in wheat exports over three different areas....
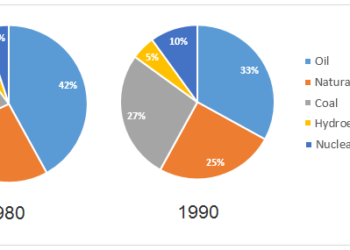
» You should spend about 20 minutes on this task. The two graphs show the main sources of energy in the USA in...
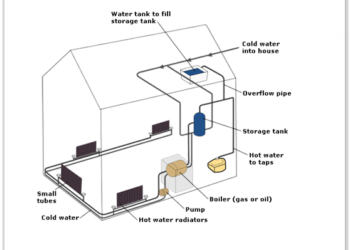
You should spend about 20 minutes on this task. The diagram below shows how a central heating system in a house works. Summarise...
9IELTS is dedicated to providing free materials and resources for IELTS conquerors. Stay constantly updated with a wide range of ultimate tips, strategies, and practice tests to crack the high-stakes IELTS exam!