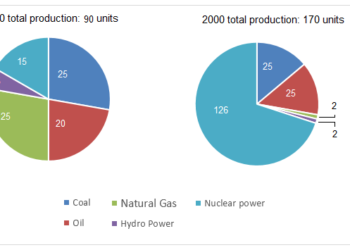
Units of electricity production by fuel source in Australia and France
» You should spend about 20 minutes on this task. The pie charts below show units of electricity production by fuel source Australia...
» You should spend about 20 minutes on this task. The pie charts below show units of electricity production by fuel source Australia...
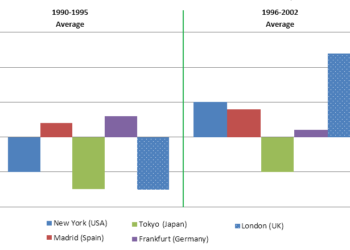
» You should spend about 20 minutes on this task. The chart below shows information about changes in average house prices in five...
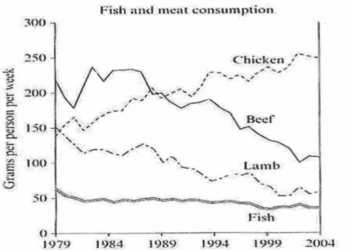
» You should spend about 20 minutes on this task. The graph below shows the consumption of fish and different kinds of meat...
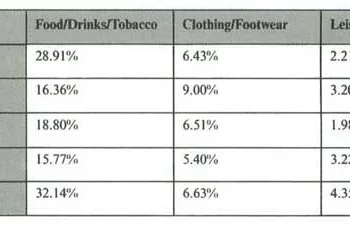
You should spend about 20 minutes on this task. The table below gives information on consumer spending on different items in five different...

» You should spend about 20 minutes on this task. The charts below give information about USA marriage and divorce rates between 1970...
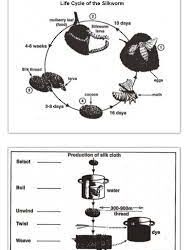
» You should spend about 20 minutes on this task. The diagrams below show the life cycle of the silkworm and the stages...
» You should spend about 20 minutes on this task. The graph below shows the proportion of the population aged 65 and over...
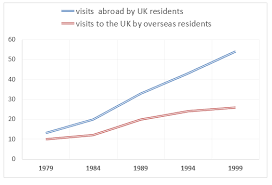
» You should spend about 20 minutes on this task. The charts below give information about travel to and from the UK, and...

» You should spend about 20 minutes on this task. The chart below shows the different levels of post-school qualifications in Australia and...

» You should spend about 20 minutes on this task. The graph below shows the demand for electricity in England during typical days...
9IELTS is dedicated to providing free materials and resources for IELTS conquerors. Stay constantly updated with a wide range of ultimate tips, strategies, and practice tests to crack the high-stakes IELTS exam!