Information about the UK’s ageing population
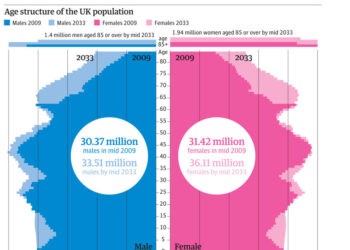
» You should spend about 20 minutes on this task. The chart below gives information about the UK's ageing population in 1985 and...
» You should spend about 20 minutes on this task. The chart below gives information about the UK's ageing population in 1985 and...
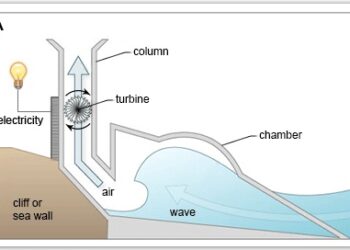
You should spend about 20 minutes on this task. The diagrams show a structure that is used to generate electricity from wave power....

» You should spend about 20 minutes on this task. The graphs below give information about computer ownership as a percentage of the...

» You should spend about 20 minutes on this task. The chart below shows the percentage change in the share of international students...
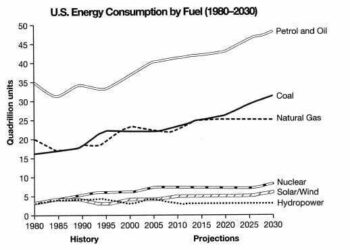
» You should spend about 20 minutes on this task. The graph below gives information from a 2008 report about consumption of energy...
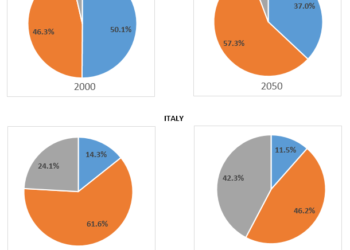
You should spend about 20 minutes on this task. The charts below give Information on the ages of the populations of Yemen and...
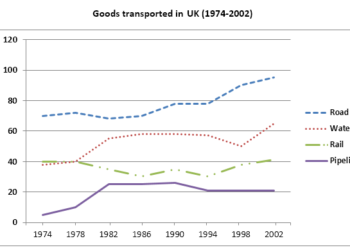
» You should spend about 20 minutes on this task. The graph below shows the quantities of goods transported in the UK between...
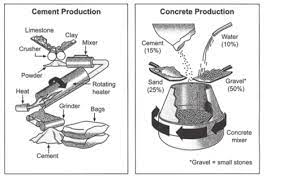
» You should spend about 20 minutes on this task. The diagram below shows the stages and equipment used in the cement-making process,...
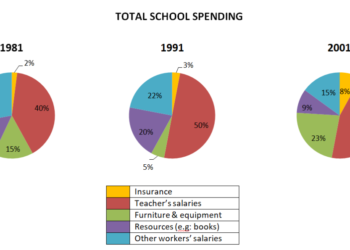
You should spend about 20 minutes on this task. The three pie charts below show the changes in annual spending by a particular...
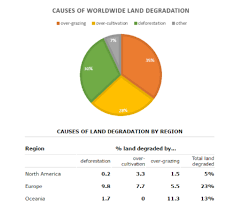
» You should spend about 20 minutes on this task. The pie chart below shows the main reasons why agricultural land becomes less...
9IELTS is dedicated to providing free materials and resources for IELTS conquerors. Stay constantly updated with a wide range of ultimate tips, strategies, and practice tests to crack the high-stakes IELTS exam!