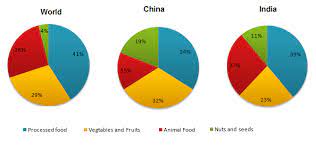
Consumption of food in 2008 in China and India
» You should spend about 20 minutes on this task. The pie charts show the average consumption of food in the world in...
» You should spend about 20 minutes on this task. The pie charts show the average consumption of food in the world in...

» You should spend about 20 minutes on this task. The graphs show changes in spending habits of people in the UK between...

» You should spend about 20 minutes on this task. The pie chart below shows the proportion of different categories of families living...

» You should spend about 20 minutes on this task. The bar charts below give information about the railway system in six cities...

» You should spend about 20 minutes on this task. The graphs show figures relating to hours worked and stress levels amongst professionals...

» You should spend about 20 minutes on this task. The table below gives information about changes in modes of travel in England...

» You should spend about 20 minutes on this task. The bar chart below gives information about four countries spending habits of shopping...

You should spend about 20 minutes on this task. The table below highlights data on the number of travellers using three major German...

» You should spend about 20 minutes on this task. The pie chart gives information on UAE government spending in 2000. The total...
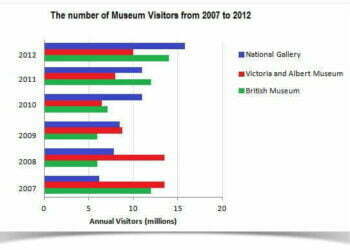
» You should spend about 20 minutes on this task. The bar chart shows the number of visitors to three London Museums between...
9IELTS is dedicated to providing free materials and resources for IELTS conquerors. Stay constantly updated with a wide range of ultimate tips, strategies, and practice tests to crack the high-stakes IELTS exam!